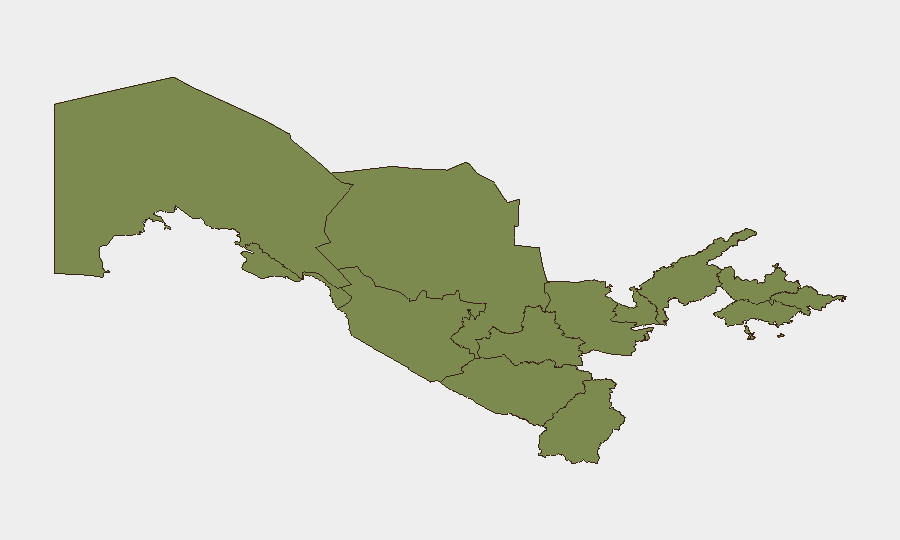
Situation Summary
Uzbekistan remains a low-threat environment globally (rank #179; composite score 3), with no credible reports of active security incidents, civil unrest, armed clashes, or infrastructure disruption in the last 24–48 hours. Recent event signals capture administrative and diplomatic statements rather than disruptive incidents; the most substantive development is a tourism e-visa program expansion announced 24–25 June, a facilitative policy measure. Overall security posture is stable; risk is heavily concentrated in Navoiy Region, which accounts for the vast majority of the national composite threat score.
Key Developments
- Nationwide (24–25 June 2026): Uzbekistan's tourism authorities announced an expansion of the e-visa program to simplify entry for tourists and business travelers. This is a travel-facilitation initiative with no security implications.
- Event signals logged 22–24 June indicate diplomatic and banking-related public statements and US investigations into unspecified matters; however, no corroborated open-source reports confirm disruptive incidents, arrests, or policy changes tied to these statements.
- No new armed incidents, protests, civil unrest, cyber attacks, terrorism alerts, or infrastructure failures have been documented in Uzbekistan in the last 48 hours per available open-source monitoring.
- Travel advisories and formal warnings: No new or updated travel restrictions or security advisories from major governments have been issued for Uzbekistan in the last 24–48 hours.
Highest-Risk Areas
Navoiy Region dominates the national risk profile with a composite score of 31.9—nearly 3× the score of Tashkent (10.9) and approximately 9–17× the scores of all other regions. This concentration suggests either persistent security or stability-related tensions localized to Navoiy, industrial/extractive infrastructure concerns, or historical event clustering in that area. Tashkent, as the capital and largest urban center, carries moderate baseline risk (10.9) reflective of population density and administrative activity. All other 10 regions score 1.9–3.4, indicating low and relatively uniform risk profiles across provincial Uzbekistan.
How GeoBit Would Assist
Security teams with personnel or assets in Uzbekistan should employ persistent area-of-interest (AOI) monitoring and early warning capabilities focused on Navoiy Region and Tashkent to capture emerging incidents in real time. Intel Sweep, global event feeds, and multi-language OSINT fusion—including X/Telegram monitoring, news aggregation, and entity extraction—provide continuous corroboration and sentiment analysis to distinguish administrative announcements from genuine security events. For duty-of-care planning, alternative routing and network analysis supports contingency journey planning; satellite and imagery analysis can assess infrastructure integrity and access in high-risk areas; and regime-stability and border monitoring tools help teams anticipate policy or administrative shifts affecting entry, movement, or business operations.
7-Day Outlook
No significant escalation in baseline security risk is anticipated over the next 7 days. The e-visa expansion and recent diplomatic/banking statements suggest active administration but not instability. Teams should maintain standard operational security posture and monitor Navoiy Region closely; any cluster of events in Tashkent during the next reporting cycle warrants closer analysis to determine whether signals represent administrative routine or emerging concern.
Highest-Risk Areas — Ranked
| # | State / Region | Risk |
|---|---|---|
| 1 | Navoiy Region | 31.9 |
| 2 | Tashkent | 10.9 |
| 3 | Bukhara Region | 3.4 |
| 4 | Qashqadaryo Region | 1.9 |
| 5 | Surxondaryo Region | 1.9 |
| 6 | Fergana Region | 1.9 |
| 7 | Republic of Karakalpakstan | 1.9 |
| 8 | Xorazm Region | 1.9 |
| 9 | Jizzakh Region | 1.9 |
| 10 | Tashkent Region | 1.9 |
| 11 | Namangan Region | 1.9 |
| 12 | Sirdaryo Region | 1.9 |
Previous Daily Briefs
A new Uzbekistan brief is written every day — each with its own risk map and downloadable CSV. Here's the last week; use the calendar to go further back.
📅 Browse every day by calendar →
Highlighted days have a brief. Tap a day for that day's map & analysis, or “csv” for that day's dataset ($5).