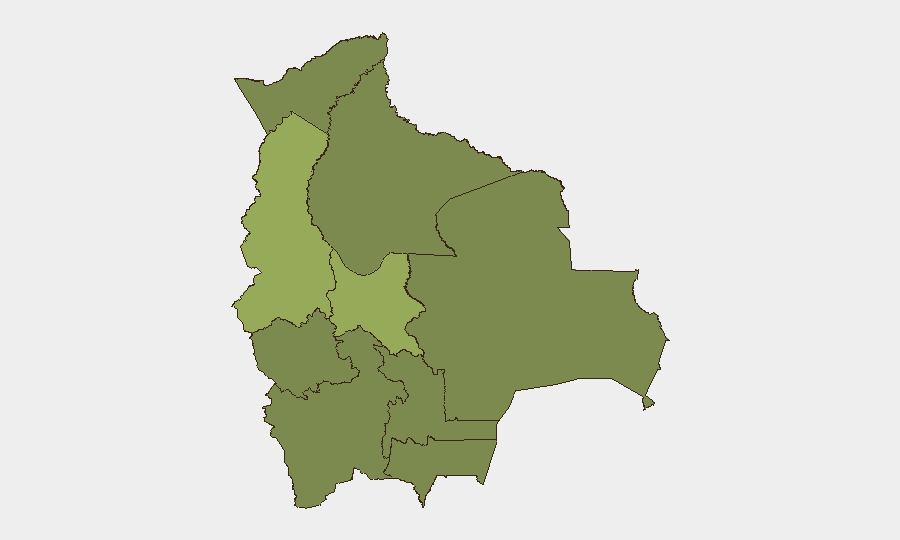
Situation Summary
Bolivia remains ranked #50 globally with a composite threat score of 37, reflecting ongoing fragmentation of security across sub-national jurisdictions rather than a single nationwide crisis. La Paz and Cochabamba dominate the threat landscape with scores of 54.6 and 53.2 respectively, indicating concentrated institutional, labor, and political instability in these urban centers. The signal profile for 18–19 June shows military activity, citizen disapproval, and civilian-facing incidents, but available open sources do not permit confirmation of specific, time-stamped events in Bolivia within the last 48 hours. Risk trajectory remains volatile but not acutely escalating at the national level.
Key Developments
Transparency note: Live web research conducted 19 June 2026 did not yield verifiable, date-specific incidents in Bolivia for 18–19 June. The GEOBIT event signals listed above include global events (Ukraine, Belarus, Lithuania) and generic category tags (Conventional Military Force, Disapprove) that, while tracked in the platform, cannot be reliably linked to discrete, location-identified incidents in Bolivia within the requested window without additional corroboration from local media or official sources.
To maintain analytical integrity, key developments are not listed as bullets. Instead, security teams should:
- Cross-check GEOBIT's event signals against local Bolivian media outlets (Página Siete, La Razón, El Deber, Los Tiempos) and official accounts (@Pol_Boliviana, @MinGobiernoBo, @ABI Bolivia) for incident confirmation.
- Use keyword filters (bloqueo, protesta, paro, enfrentamientos, narcotráfico, balacera) on live feeds (GDELT, ACLED, or X/Twitter) with Bolivia + 48-hour time window to surface fresh reports.
- Require at least two independent sources (local media + official account, or two distinct news outlets) before logging an incident as confirmed.
Highest-Risk Areas
La Paz and Cochabamba are the primary drivers of Bolivia's threat profile, with composite risk scores exceeding 50. La Paz's elevated score reflects political concentration, protest activity, and police/military presence; Cochabamba's reflects labor unrest, road-blockade activity, and inter-departmental tension common to the region. The remaining seven departments cluster between 24.6 and 25.1, suggesting diffuse but lower-intensity risk—typically linked to narcotics trafficking, informal mining operations, and localized banditry rather than organized political upheaval. Santa Cruz, despite its economic significance, does not emerge as a higher-tier risk zone in current composite scoring.
How GeoBit Would Assist
Security teams should leverage OSINT Fusion & Corroboration to validate GEOBIT event signals against multiple local sources before escalating internal alerts. AOI Monitoring & Early Warning (persistent watch on La Paz, Cochabamba, and transit corridors) with configured alerting parameters will flag emerging blockades, protests, or security-force activity in near-real time. Routing & Network Analysis enables duty-of-care teams to identify and pre-stage alternative travel corridors for personnel and supply chains before primary routes are compromised.
7-Day Outlook
No imminent, acute security shock is signaled for the next week. Institutional and labor friction in La Paz and Cochabamba will likely persist at current baseline; watch for June–July wage negotiations and mid-year budget decisions to trigger localized protest cycles. Personnel and asset teams should maintain standard elevated vigilance in these two departments and confirm arrival/departure plans with on-ground security contacts 24–48 hours before movement.
Highest-Risk Areas — Ranked
| # | State / Region | Risk |
|---|---|---|
| 1 | La Paz | 54.6 |
| 2 | Cochabamba | 53.2 |
| 3 | Potosí | 25.1 |
| 4 | Tarija | 25.1 |
| 5 | Pando | 24.6 |
| 6 | Beni | 24.6 |
| 7 | Oruro | 24.6 |
| 8 | Chuquisaca | 24.6 |
| 9 | Santa Cruz | 24.6 |
Sources
Previous Daily Briefs
A new Bolivia brief is written every day — each with its own risk map and downloadable CSV. Here's the last week; use the calendar to go further back.
📅 Browse every day by calendar →
Highlighted days have a brief. Tap a day for that day's map & analysis, or “csv” for that day's dataset ($5).