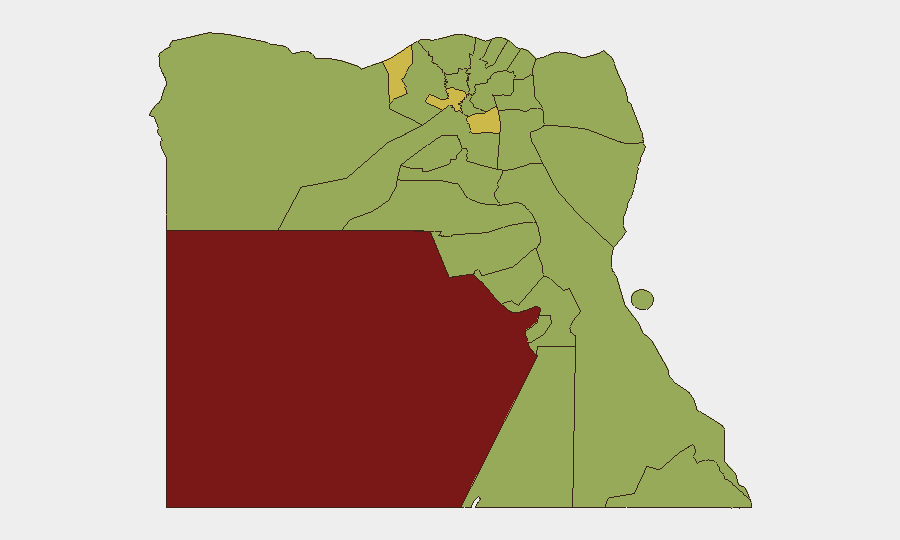
Situation Summary
Egypt maintains a composite threat score of 79 (rank #25 globally), reflecting persistent security fragmentation across sub-national regions rather than a unified national crisis. The threat landscape is dominated by localized instability in New Valley, Alexandria, and the Cairo metropolitan area, alongside enduring counterinsurgency operations in Sinai. No major escalation or new nationwide incident has been documented in the past 24–48 hours; the current posture reflects baseline operational risk with regional concentration.
Key Developments
Open-source intelligence does not support attribution of specific, time-stamped security or civil-unrest incidents within Egypt during 10–11 July 2026. Recent event signals in the GeoBit feed reference police/arrest activity, administrative sanctions, and public statements from government and population actors on 9 and 11 July, but lack precise location, timing, and corroborated detail necessary for operational briefing. Regional diplomatic activity—including US–Iran posturing, Egypt–Qatar coordination, and Israeli–Egyptian military liaison—continues at a strategic level but does not constitute an acute domestic security development. Until corroborated reporting confirms specific incidents with location and date, risk teams should reference sub-national threat scores and historical patterns (Sinai counterinsurgency, trafficking corridors, protest activity in urban centers) as the operative baseline.
Highest-Risk Areas
New Valley (score 85.4) and Alexandria (69.4) drive the highest composite risk, followed by Cairo (60.9) and Al Minufiya (60.5). New Valley's elevation reflects trafficking networks, remote governance challenges, and resource-access disputes in the Western Desert; Alexandria's ranking reflects maritime-smuggling infrastructure, population density, and historical protest activity. Cairo's 60.9 score underscores concentrated political risk, large transient populations, and dense critical infrastructure; secondary clustering around Sinai provinces (North, South, 55.4 each) reflects ongoing counterterrorism operations against ISIS-affiliated groups. Risk teams with personnel or assets in these regions should apply heightened due diligence and active monitoring protocols.
How GeoBit Would Assist
Security and risk teams should deploy Area-of-Interest (AOI) Monitoring & Early Warning on high-risk governorates—particularly New Valley, Alexandria, and Cairo—to receive real-time alerts on emerging protest activity, security force deployments, or incident signals before they mature. Intel Sweep, multi-language OSINT, and X/Telegram monitoring provide daily pulse-checks on government statements, population sentiment, and actor network activity, enabling early detection of policy shifts or unrest precursors. Conflict and regime-stability search functions allow targeted review of Sinai force posture, trafficking patterns, and political-friction zones to support journey-risk assessment and asset-security planning.
7-Day Outlook
No acute escalation is forecast over the near term. Operational risk will likely track the baseline established by sub-national scores: persistent Sinai counterinsurgency, seasonal trafficking flows through New Valley and Red Sea corridors, and periodic protest activity in metropolitan centers. Risk teams should monitor for any secondary effects of regional diplomatic tensions (US–Iran, Arab–Israel dynamics) on Egyptian government posture or port/border security protocols, particularly around the Suez Canal and northeastern border zones.
Highest-Risk Areas — Ranked
| # | State / Region | Risk |
|---|---|---|
| 1 | New Valley | 85.4 |
| 2 | Alexandria | 69.4 |
| 3 | Cairo | 60.9 |
| 4 | Al Minufiya | 60.5 |
| 5 | Matruh | 56.2 |
| 6 | Giza | 55.8 |
| 7 | North Sinai | 55.4 |
| 8 | Qena | 55.4 |
| 9 | South Sinai | 55.4 |
| 10 | Red Sea | 55.4 |
| 11 | Halaib Triangle | 55.4 |
| 12 | Kafr El Sheikh | 55.4 |
Sources
Previous Daily Briefs
A new Egypt brief is written every day — each with its own risk map and downloadable CSV. Here's the last week; use the calendar to go further back.
📅 Browse every day by calendar →
Highlighted days have a brief. Tap a day for that day's map & analysis, or “csv” for that day's dataset ($5).
Atlas — our AI intelligence desk — emails them this snapshot personally. Nothing else, no list.