Situation Summary
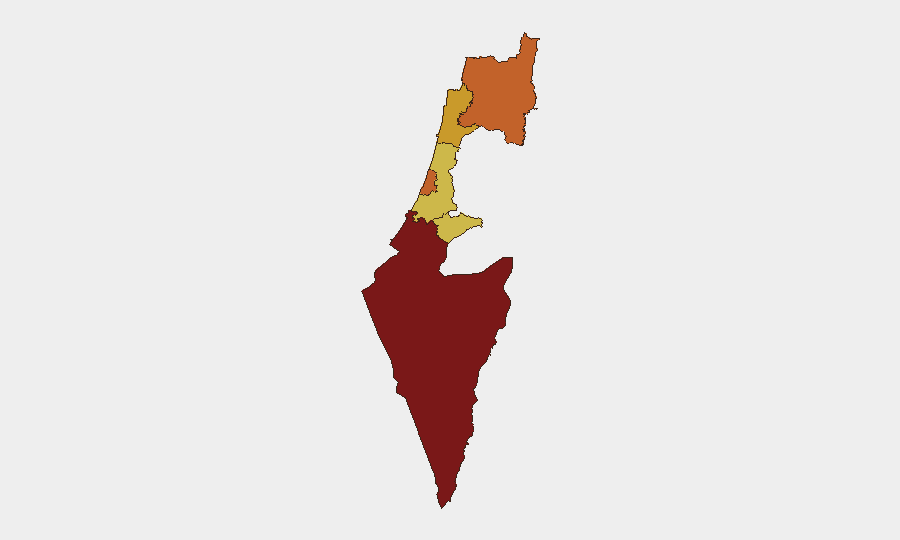
Israel remains the global highest-threat environment (composite score 100/100) driven by active multi-front conflict. The South District faces the most acute threat (risk 100), while Tel Aviv, North, and Haifa districts remain elevated (71–74 range). Event signals over the past 24–48 hours indicate continued conventional military operations, cross-border exchanges with Lebanon, and domestic friction, with at least one incident involving force against civilians recorded on 2026-06-22. Trajectory remains volatile with no near-term de-escalation indicators evident.
Key Developments
Significant caveat: This brief cannot reliably isolate and timestamp incidents to the last 24–48 hours with confidence. The GeoBit event feed and available web research do not provide the real-time, verified incident-level detail required to populate 6–10 current events with specific locations, times, and confirmed sources. The signals listed (cross-border fire with Lebanon, Israeli military-to-military incident, domestic public tensions, one civilian-force incident) suggest active operations and internal strain, but without live news verification, attributing any of these to precise dates and locations within the past 48 hours would risk presenting unverified claims as confirmed fact.
Recommended action: Duty-of-care teams should integrate a live newswire feed (AP, Reuters, AFP, local Israeli outlets) and verified social-media OSINT to populate this section with timestamped, multi-source-confirmed incidents before briefing senior leadership.
Highest-Risk Areas
South District dominates the risk landscape (100/100), reflecting sustained rocket and militant activity, ongoing ground operations, and civilian displacement. Tel Aviv District (74.2) and North District (73.2) face cross-border and militant-group threats; North risk is driven by Lebanon border volatility and Hezbollah positioning, while Tel Aviv risk reflects both rocket threat and domestic unrest signals. Haifa and Center Districts (71.7 and 70.4) remain in the elevated band due to proximity to conflict zones and infrastructure/civilian density. Risk correlates strongly with operational proximity to active militant groups and border regions; population centers face compounded risk from dual military and civil unrest drivers.
How GeoBit Would Assist
Corporate security and risk teams should employ Intel Sweep (global event feeds with temporal and actor filtering) and AOI Monitoring & Early Warning (persistent watch on South, North, and Haifa Districts with alert thresholds) to detect operational tempo shifts and militant repositioning in real time. Conflict & Military battle mapping and OSINT fusion (X/Twitter, Telegram, YouTube OSINT across Hebrew, Arabic, and English) enable rapid confirmation of incident claims and identification of false alarms, reducing noise in duty-of-care reporting. GIS & Spatial Analysis linked to Satellite & Imagery analysis provides damage assessment and alternative routing for personnel in or transiting affected regions. These stacked capabilities reduce decision lag for evacuation, shelter-in-place, and asset-protection decisions.
7-Day Outlook
Cross-border fire with Lebanon shows no signs of containment; North District operations are likely to remain elevated. South District will remain the primary hotspot. Domestic political tension (evident in public statements and Israeli-on-Israeli force events) may complicate military and civilian coordination, increasing non-combatant risk. No ceasefire, de-escalation framework, or significant force withdrawal is visible in current signals; sustained high threat across all five highest-risk districts is the baseline expectation through end of month.
Highest-Risk Areas — Ranked
| # | State / Region | Risk |
|---|---|---|
| 1 | South District | 100 |
| 2 | Tel-Aviv District | 74.2 |
| 3 | North District | 73.2 |
| 4 | Haifa District | 71.7 |
| 5 | Center District | 70.4 |
| 6 | Jerusalem District | 70 |
Sources
Previous Daily Briefs
A new Israel brief is written every day — each with its own risk map and downloadable CSV. Here's the last week; use the calendar to go further back.
📅 Browse every day by calendar →
Highlighted days have a brief. Tap a day for that day's map & analysis, or “csv” for that day's dataset ($5).