Situation Summary
Mexico's composite threat score remains elevated at 98 (rank #11 globally), driven primarily by organized criminal violence across 1,029 tracked events. Recent signal activity (21–23 June) points to concurrent institutional stress—government-army friction, prosecutor involvement, and territorial occupation in Mexico City—alongside ongoing cartel-related activity. The security environment reflects fragmentation across multiple threat vectors rather than a single escalating conflict, creating unpredictable risk pockets by region and sector.
Key Developments
GeoBit's current event feed identifies the following signals requiring investigation or monitoring:
- 23 June · Mexico City territorial occupation: Unspecified actors occupy territory in Mexico City; institutional response and duration unclear. Requires confirmation of actor identity, location precision, and operational intent.
- 23 June · Administrative dispute with village-level impact: Local administration vs. village constituency conflict flagged; geographic location and grievance scope not yet specified.
- 23 June · Presidential statement regarding hospital: Senior-level public statement implicates health-sector institution; context and underlying dispute under investigation.
- 22 June · Territory occupied, Mexico City: Second territorial occupation signal in CDMX within 24 hours; possible continuation or separate incident.
- 22 June · Expulsion/deportation order: Ministry directive against criminal element(s); suggests targeted law-enforcement action but scope and jurisdiction unclear.
- 21–22 June · Government-Army institutional friction: Investigation-level signal indicates tension between civilian and military branches; implications for security operations and chain-of-custody uncertain.
Note: Last-24–48-hour social and news corroboration for these signals is incomplete in available research; escalation confirmation and precise casualty/displacement data pending secondary source verification.
Highest-Risk Areas
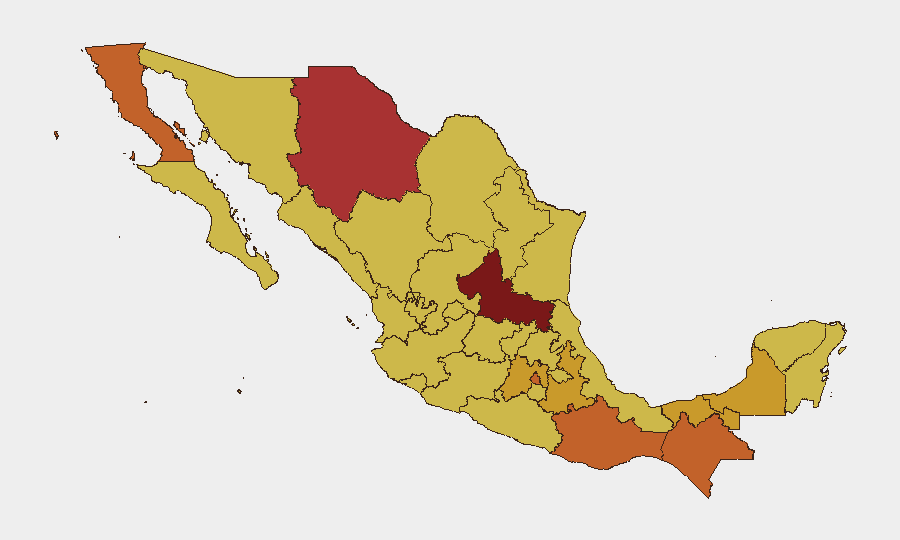
San Luis Potosí dominates the sub-national ranking (98.2), followed by a second tier of high-risk states: Chihuahua (78.6), Baja California (75.2), and Mexico City (73.7). Oaxaca, Chiapas, and Puebla form a southern cluster of sustained criminal and institutional instability (73.3–72.8), while Campeche, Tabasco, and the State of Mexico reflect cartel infiltration of commerce and transport corridors.
The concentration of risk in San Luis Potosí and northern border states (Chihuahua, Baja California) aligns with cartel supply-route competition and trafficking-related violence. Simultaneous elevation of Mexico City signals governance or inter-cartel friction within the capital's administrative boundaries. Operations or personnel in the top five states should assume elevated ambient threat levels and implement heightened duty-of-care protocols.
How GeoBit Would Assist
Intel Sweep & OSINT Fusion would correlate the six recent signals into a coherent narrative, isolating institutional actors (government vs. army), criminal groups, and motivation. AOI Monitoring & Early Warning applied to San Luis Potosí, Chihuahua, and Mexico City would provide persistent, real-time alerts on territorial changes, checkpoint activity, and cartel repositioning. GIS & Spatial Analysis would map safe corridors, identify pinch points, and enable dynamic route planning for corporate personnel, while Sentiment & Temporal Analysis on Spanish-language news, X, and Telegram would flag accelerating rhetoric preceding kinetic events.
7-Day Outlook
The next week will likely clarify whether the 23 June signals represent isolated administrative friction or coordinated criminal-state tension. Mexico City's territorial occupation and Mexico City government-army friction warrant close monitoring; if both persist beyond 48 hours, risk may escalate to regional cartel repositioning or state security force realignment. Personnel in San Luis Potosí and Chihuahua should expect continued ambient violence; no significant de-escalation signal is visible in current data.
Highest-Risk Areas — Ranked
| # | State / Region | Risk |
|---|---|---|
| 1 | San Luis Potosí | 98.2 |
| 2 | Chihuahua | 78.6 |
| 3 | Baja California | 75.2 |
| 4 | Mexico City | 73.7 |
| 5 | Oaxaca | 73.3 |
| 6 | Chiapas | 73.3 |
| 7 | Puebla | 72.8 |
| 8 | Campeche | 71.8 |
| 9 | Tabasco | 71.4 |
| 10 | State of Mexico | 71.2 |
| 11 | Tlaxcala | 70.5 |
| 12 | Sinaloa | 70.3 |
Previous Daily Briefs
A new Mexico brief is written every day — each with its own risk map and downloadable CSV. Here's the last week; use the calendar to go further back.
📅 Browse every day by calendar →
Highlighted days have a brief. Tap a day for that day's map & analysis, or “csv” for that day's dataset ($5).