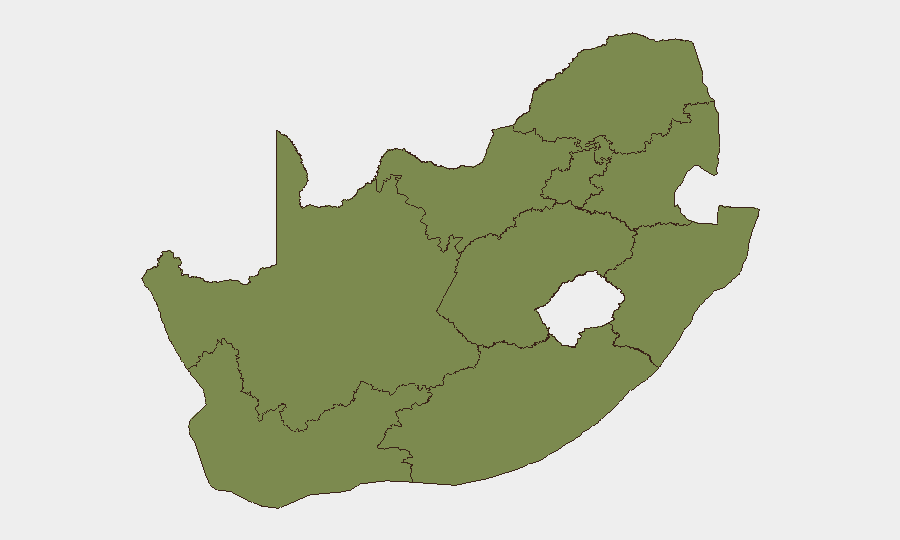
Situation Summary
South Africa's security environment remains fragmented and volatile, with Gauteng (primarily Johannesburg and Pretoria) dominating the threat landscape at a composite risk score nearly 2.5× higher than the second-ranked Western Cape. A mix of protest-driven civil unrest (particularly migration-related demonstrations that peaked around 30 June but remain active), armed robbery, extortion, and localized structural failures continues to generate incidents across major urban centers. Heavy police deployments and recent tactical operations have contained but not resolved underlying tensions, leaving the security posture dependent on sustained enforcement and event-dependent escalation.
Key Developments
- Inanda, Durban (KwaZulu-Natal) – 13 July 2026: Wall collapse at Nazareth Baptist Church complex injured 12 worshippers; 4 remain hospitalized. Event highlights structural-safety and crowd-management risks in informal and semi-formal gathering spaces.
- N8 Highway, Botshabelo–Thaba Nchu (Free State) – 13 July 2026: Three men arrested following extortion of taxi passengers; R2,500 per-person ransom demanded. Illustrates persistent intercity transport-corridor vulnerability and organized criminal activity on trunk routes.
- Kew, Johannesburg (Gauteng) – mid-July 2026 (24–48h window): Gunmen fired on vehicle, killing a woman and injuring driver. Incident reflects continued armed-robbery and gang-related violence in northern Johannesburg suburbs despite police presence.
- Winifred Mandela Precinct, Sandton/Johannesburg – 14 July 2026: False-alarm shooting alert; police clarified no active incident. Heightened sensitivity to gun-violence threats and rapid emergency-response mobilization underscore strain on security infrastructure and alert fatigue risk.
- Nationwide migration-related protest activity – ongoing through July 2026: French Foreign Ministry notes demonstrations across KwaZulu-Natal, Gauteng, and Eastern Cape; peak expected around 30 June has passed, but authorities caution potential for renewed large-scale unrest. Security forces remain mobilized.
- Police Minister statement – 12 July 2026: Acting Police Minister Firoz Cachalia publicly defended R600 million June 30 policing operation, signaling sustained high-alert posture and heavy deployments in key urban areas justified by prevention of escalated violence.
Highest-Risk Areas
Gauteng's composite risk score of 33.9 reflects sustained armed robbery, carjacking, protest-related disruption, and gang activity concentrated in Johannesburg CBD, surrounding townships, and northern suburbs (Sandton, Kew, Midrand corridor). Western Cape (13.8) and Eastern Cape (9.3) follow as secondary urban hotspots; KwaZulu-Natal (8.0), despite lower ranking, remains critical owing to ongoing migration-related demonstrations and coastal/port-area crime. Collectively, these five provinces account for ~70% of tracked threat events, with Gauteng alone driving nearly two-thirds of national composite risk.
How GeoBit Would Assist
Teams should deploy AOI Monitoring & Early Warning on critical nodes (Johannesburg CBD, Sandton, Durban CBD, Pretoria CBD) to detect emerging protest clusters, roadblocks, or security operations in real time. Intel Sweep (multi-language X/Telegram/YouTube feeds, sentiment & temporal analysis) will surface migration-protest momentum and localized criminal-gang activity intelligence 24–48 hours ahead of mass mobilization. Routing & Network Analysis enables dynamic alternative-route planning for personnel and logistics around known crime corridors and protest zones.
7-Day Outlook
Migration-related demonstrations are expected to remain episodic rather than continuous through mid-to-late July, but risk of rapid escalation around political announcements or high-profile incidents (police shootings, labor actions) remains material. Armed robbery and extortion on intercity transport corridors will persist; corporate and NGO convoys should assume elevated threat posture in Gauteng and Free State trunk routes. Heavy police presence will likely remain visible through end-month, providing deterrent effect but also creating flashpoint risk if enforcement actions escalate.
Highest-Risk Areas — Ranked
| # | State / Region | Risk |
|---|---|---|
| 1 | Gauteng | 33.9 |
| 2 | Western Cape | 13.8 |
| 3 | Eastern Cape | 9.3 |
| 4 | KwaZulu-Natal | 8 |
| 5 | North West | 6.1 |
| 6 | Free State | 5.9 |
| 7 | Limpopo | 5 |
| 8 | Northern Cape | 3.8 |
| 9 | Mpumalanga | 3.8 |
Sources
Previous Daily Briefs
A new South Africa brief is written every day — each with its own risk map and downloadable CSV. Here's the last week; use the calendar to go further back.
📅 Browse every day by calendar →
Highlighted days have a brief. Tap a day for that day's map & analysis, or “csv” for that day's dataset ($5).
Atlas — our AI intelligence desk — emails them this snapshot personally. Nothing else, no list.