Situation Summary
China remains at composite threat rank #17 globally (score 77), with 542 tracked events reflecting elevated diplomatic tension, military activity, and cross-strait posturing over the past 72 hours. Recent signals include U.S. and EU public statements of disapproval, Washington sanctions action, and reported conventional military force movements, alongside domestic investigations and law enforcement detentions. The threat landscape is driven primarily by geopolitical friction rather than acute internal instability, though regional variance is significant.
Key Developments
- 2026-06-21 · Washington Sanctions – U.S. imposed new administrative sanctions on China; specific targets and sectoral scope not yet detailed in available reporting.
- 2026-06-21 · EU Public Statement – European Union issued formal disapproval statement regarding China; scope and duration of diplomatic response under monitoring.
- 2026-06-21 · Domestic Investigation – China authorities launched investigation (entity and subject matter not specified in current brief); asset-holding or personnel-adjacent implications warrant monitoring.
- 2026-06-20 · Conventional Military Force Activity – Chinese military movement or exercise reported; scale, location, and duration require clarification from imagery and signals intelligence.
- 2026-06-19 · Taiwan Cross-Strait Statement – China issued public statement toward Taiwan; rhetoric level and operational indicators consistent with elevated but non-kinetic posture.
- 2026-06-20 · South Korea Diplomatic Disapproval – China–South Korea diplomatic friction; secondary to U.S./EU signals but suggests regional coalition messaging.
- 2026-06-20 · Domestic Threat Signal – Unspecified threat statement issued by Chinese actors; context and target audience require clarification.
Data Limitation: Current web research did not yield granular China incident details for the 24–48 hour window. GeoBit's X/Twitter OSINT, Telegram feeds, and multi-language event monitoring recommend immediate re-sweep for specificity on military location, investigation subject, and sanctions scope.
Highest-Risk Areas
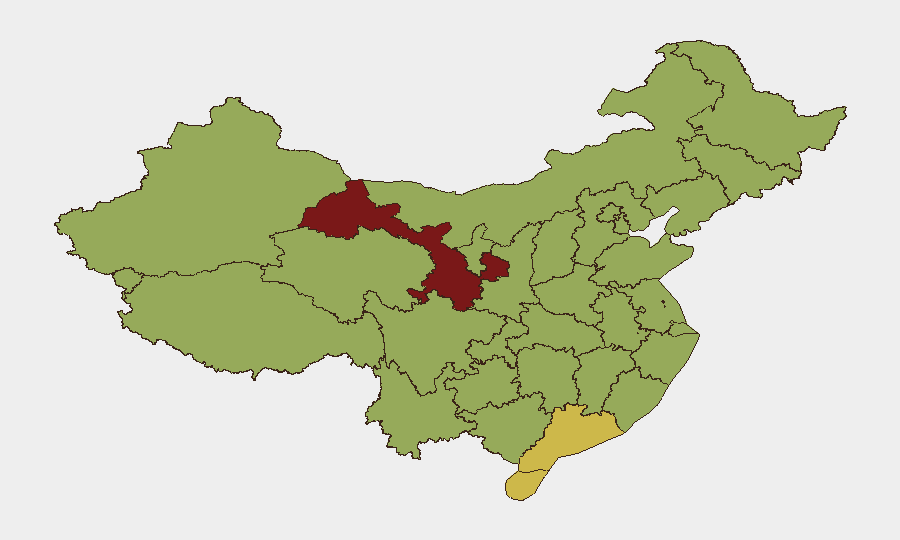
Gansu Province leads sub-national risk at 83.5, significantly outpacing the national average and warranting dedicated AOI monitoring; inland economic and border-adjacent sensitivities likely drive this elevation. Hainan (62.5) and Guangdong (61.8) follow, both maritime-proximate and cross-strait-sensitive; elevated risk reflects Taiwan-related military posturing and potential supply-chain/port disruption exposure. Beijing (59.9) and Shanghai (56.8) rank 4th and 5th respectively, driven by political-administrative concentration and international business presence; diplomatic friction and sanctions compliance verification are primary duty-of-care concerns. Coastal and southern tier provinces (Fujian, Zhejiang, Jiangsu) cluster at 54–56, consistent with Taiwan-strait vulnerability and maritime chokepoint exposure.
How GeoBit Would Assist
Intel Sweep & OSINT Fusion – Immediate multi-language X, Telegram, and YouTube intelligence sweep would clarify military unit identity, location, and exercise scope, plus define the domestic investigation's corporate or asset-holding nexus. AOI Monitoring & Satellite Imagery – Persistent geospatial watch on Gansu, Hainan, and Guangdong ports, military installations, and cross-strait staging areas would provide kinetic early warning and rule out operational escalation. Sanctions Compliance & Network Analysis – Entity extraction and counterparty-relationship mapping would identify secondary exposure to newly sanctioned Chinese actors and enable rapid supply-chain recalibration.
7-Day Outlook
Diplomatic tension is likely to persist or incrementally deepen through G7 coordination and EU statements; military exercises may expand in scale or frequency as signaling. No imminent kinetic escalation indicators are present, but cumulative friction increases operational dislocation risk for mainland-based personnel and supply chains. Gansu, Hainan, and coastal provinces warrant heightened monitoring for incident clustering or sudden policy announcements.
Highest-Risk Areas — Ranked
| # | State / Region | Risk |
|---|---|---|
| 1 | Gansu | 83.5 |
| 2 | Hainan Province | 62.5 |
| 3 | Guangdong Province | 61.8 |
| 4 | Beijing | 59.9 |
| 5 | Shanghai | 56.8 |
| 6 | Hubei | 56.5 |
| 7 | Fujian | 55.6 |
| 8 | Guizhou | 55.6 |
| 9 | Yunnan | 54.2 |
| 10 | Zhejiang | 54.2 |
| 11 | Jiangsu | 54.1 |
| 12 | Jiangxi | 54.1 |
Sources
Previous Daily Briefs
A new China brief is written every day — each with its own risk map and downloadable CSV. Here's the last week; use the calendar to go further back.
📅 Browse every day by calendar →
Highlighted days have a brief. Tap a day for that day's map & analysis, or “csv” for that day's dataset ($5).