Situation Summary
Rwanda maintains a composite threat ranking of #66 globally with a score of 20 across 244 tracked events, indicating a relatively stable security environment compared to regional peers. Kigali City exhibits materially higher risk (32.2) than all other provinces, which cluster at 2.2, reflecting urban concentration of civil activity and reported demonstrations. Current open-source reporting does not surface major security incidents, civil unrest, or infrastructure disruption in the 24–48 hours preceding 30 July 2026. The security picture remains consistent with government advisories recommending normal safety precautions.
Key Developments
No verifiable, time-stamped security incidents, civil unrest, crime spikes, or infrastructure disruption have been identified in open sources for Rwanda in the 24–48 hours ending 30 July 2026. The most recent dated event signals include a student demonstration/rally (30 July, location unspecified), internal disapproval activity (28 July), and a demand-type event (29 July), but specific locations, scale, and outcomes are not detailed in available reporting. Two recent Marburg virus disease event signals have been logged but lack current epidemiological detail or confirmed case counts. Official Rwanda National Police and Rwanda Defence Force channels have not published incident alerts or advisories as of the last available update (26 July for regional diplomatic activity). The absence of incident reporting in major Rwanda news outlets and travel advisories suggests no acute, widely recognized disturbance; however, this reflects a lag in open-source publication rather than confirmation of safety.
Highest-Risk Areas
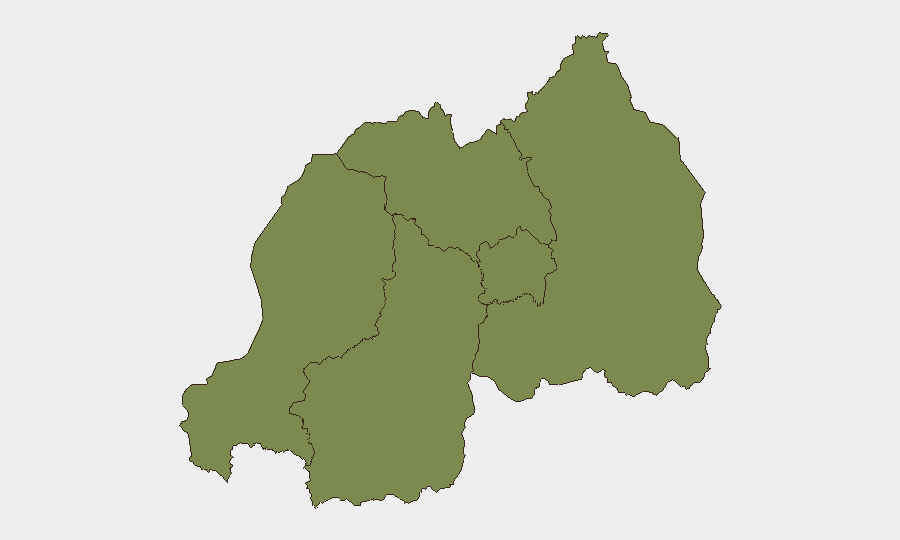
Kigali City dominates the sub-national risk profile at 32.2, more than 14 times higher than any other province. The Western, Northern, Southern, and Eastern provinces each score 2.2, reflecting either lower baseline activity or more dispersed, lower-profile events. Urban concentration of government, commerce, diplomatic presence, and civil organization in Kigali explains the risk differential; demonstrations, labor actions, and political activity naturally cluster in the capital. Personnel and assets outside Kigali operate in a substantially lower-threat environment, though cross-border dynamics (particularly near Rubavu and Rusizi in the west, given refugee movement patterns observed in late July) merit monitoring.
How GeoBit Would Assist
Continuous AOI Monitoring & Early Warning focused on Kigali and provincial capitals would detect emerging civil unrest, demonstrations, or security incidents with alerting as events develop. Intel Sweep and OSINT fusion across Rwanda National Police bulletins, New Times archives, regional news feeds, and X/Twitter activity would close the 24–48-hour reporting lag and surface minor incidents not yet flagged by mainstream media. Sentiment & temporal analysis on Rwanda-focused social channels and conflict event mapping would establish baseline protest activity, grievance trends, and geographic hot spots, enabling rapid escalation detection and duty-of-care briefing to personnel in high-risk zones.
7-Day Outlook
Student and civil-society activity signals suggest potential for continued low-level demonstrations, particularly in Kigali, over the near term; these events are currently below the threshold of major security concern but warrant routine monitoring. No indicators of imminent large-scale unrest, military action, or infrastructure disruption are present in available intelligence. Security teams should maintain normal situational awareness and sustain contact with local partners and official channels for any material changes in the trajectory.
Highest-Risk Areas — Ranked
| # | State / Region | Risk |
|---|---|---|
| 1 | Kigali City | 32.2 |
| 2 | Western Province | 2.2 |
| 3 | Northern Province | 2.2 |
| 4 | Southern Province | 2.2 |
| 5 | Eastern Province | 2.2 |
Sources
Previous Daily Briefs
A new Rwanda brief is written every day — each with its own risk map and downloadable CSV. Here's the last week; use the calendar to go further back.
📅 Browse every day by calendar →
Highlighted days have a brief. Tap a day for that day's map & analysis, or “csv” for that day's dataset ($5).
Atlas — our AI intelligence desk — emails them this snapshot personally. Nothing else, no list.