Situation Summary
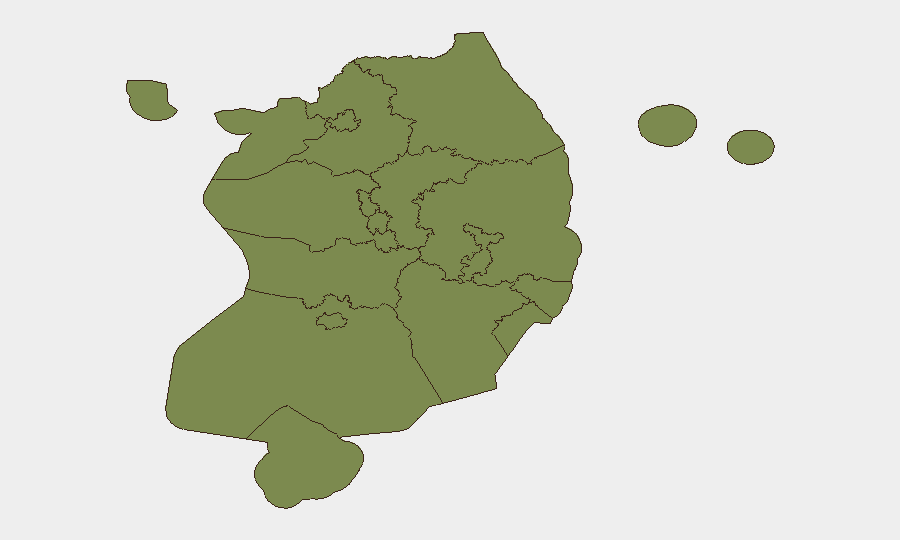
South Korea remains a stable, low-threat environment globally (rank #138, composite score 5.0), with no major security incidents reported in the last 24–48 hours. Risk is heavily concentrated in Seoul (score 31.4), which dominates the national profile, while most other regions show minimal threat exposure. The recent event signals reflect policy statements, administrative actions, and diplomatic posturing rather than acute security crises; no verifiable terrorist attacks, mass protests, infrastructure disruptions, or sudden instability events have entered major wire services in the current reporting window.
Key Developments
- No new high-impact incidents confirmed in the last 24–48 hours from major Korean news outlets (Yonhap, KBS, JTBC) or official government alerts. Routine cybersecurity advisories and ongoing North Korea diplomatic rhetoric continue, but these pre-date the immediate window or lack specific triggering events.
- Seoul remains the dominant risk node for the country, accounting for the vast majority of the national composite threat score. This reflects the capital's role as the seat of government, media, financial centers, and diplomatic presence—concentrating political, protest, and symbolic-targeting risk.
- North Chungcheong Province (score 23.9) shows secondary but significant elevation, likely tied to proximity to the DMZ and border-related tensions. A previously announced adjustment of the Civilian Control Line near the DMZ (reported June 16–17) reflects ongoing policy evolution rather than a new incident.
- All other regions register minimal risk (scores 1.4–3.1), indicating geographically dispersed, low-frequency event patterns. This regional distribution suggests risk is not systemic across South Korea but concentrated in the capital and border-adjacent areas.
- Event signal mix includes diplomatic statements and administrative actions (North Korea rhetoric, China–South Korea posturing, student sanctions, internal investigations) rather than ground-level violence or direct threats to civilians or infrastructure in the last 48 hours.
Highest-Risk Areas
Seoul's dominance (risk 31.4) is driven by its density of government institutions, diplomatic missions, media headquarters, financial infrastructure, and protest activity—making it the focal point for both symbolic and operational security concerns. North Chungcheong's secondary elevation (23.9) reflects its proximity to the DMZ and susceptibility to border-related tensions and military posturing. The remaining 10 regions show negligible individual risk (all below 3.1), indicating that South Korea's threat profile is heavily concentrated in two zones rather than distributed nationally. For most of the country, routine crime, industrial, and cyber baseline risk prevail.
How GeoBit Would Assist
Corporate teams with personnel or assets in Seoul should use AOI Monitoring & Early Warning with persistent geographic watches on key facilities, government districts, and transit nodes to detect protest activity or civil unrest in real time. Intel Sweep (multi-language OSINT fusion, X/Twitter & Telegram monitoring, sentiment analysis) provides early warning of student activism, labor actions, or diplomatic escalation affecting business continuity. GIS & Spatial Analysis helps map secure routing, alternative commute paths, and safe zones during periods of elevated political tension, particularly in Seoul's dense downtown corridors.
7-Day Outlook
No significant escalation is anticipated in the near term, barring a sudden North Korean provocation or major diplomatic incident. Seoul will remain the primary watch point; routine diplomatic and administrative activity should dominate the event stream. Corporate teams should maintain standard protocols and cross-check paid intelligence feeds for any rapid-onset developments not yet visible in open sources.
Highest-Risk Areas — Ranked
| # | State / Region | Risk |
|---|---|---|
| 1 | Seoul | 31.4 |
| 2 | North Chungcheong | 23.9 |
| 3 | Jeju | 3.1 |
| 4 | Gyeonggi | 2.8 |
| 5 | South Gyeongsang | 2.6 |
| 6 | Busan | 2.3 |
| 7 | South Jeolla | 2 |
| 8 | Incheon | 1.7 |
| 9 | Gangwon State | 1.7 |
| 10 | Daegu | 1.7 |
| 11 | South Chungcheong | 1.4 |
| 12 | Sejong | 1.4 |
Sources
Previous Daily Briefs
A new South Korea brief is written every day — each with its own risk map and downloadable CSV. Here's the last week; use the calendar to go further back.
📅 Browse every day by calendar →
Highlighted days have a brief. Tap a day for that day's map & analysis, or “csv” for that day's dataset ($5).