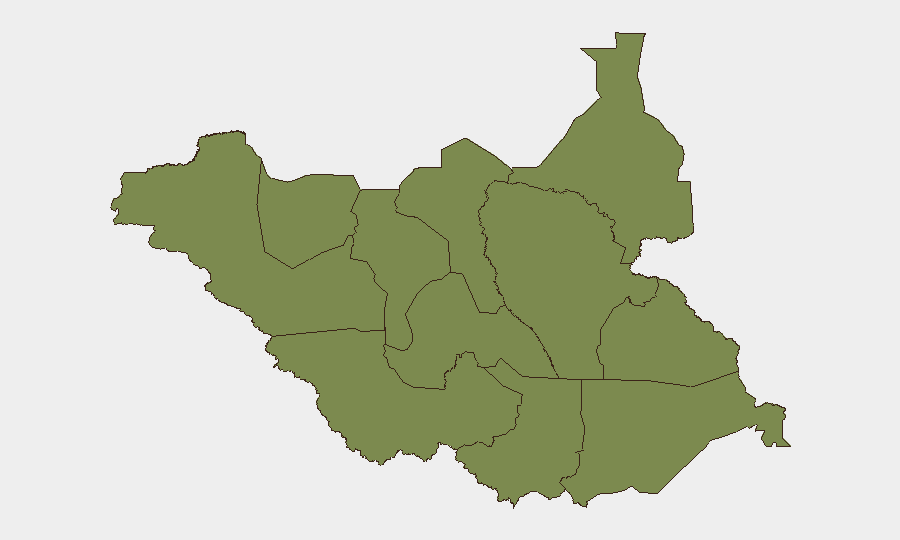
Situation Summary
South Sudan remains at composite threat rank #37 globally (score 57) with 231 tracked events. Security conditions are heavily concentrated in Unity State (risk 35) and Central Equatoria (risk 25), while most other administrative areas show baseline risk. Intercommunal violence, prison-related incidents, and ongoing UN/EU engagement signals suggest sustained instability in specific zones rather than nationwide deterioration.
Key Developments
Recent event signals flagged on 2026-07-10 include:
- Public Statement (AFRICA region) – nature and location unconfirmed; pending source verification.
- Prison-Related Incident (South Sudan) – disapproval event logged; specific location and casualty count not yet detailed in available summaries.
- Public Statement (SOUTH SUDAN) – government or institutional communication; context unclear without underlying source.
- UN Public Statement (South Sudan context) – likely related to ongoing humanitarian or political oversight; timeframe and content require verification.
- EU vs. Radio Station Statement – regulatory or advocacy action; implications for media freedom or disinformation response unclear.
Note: GeoBit's live web research (last 24–48 hours) identified one possible event—ICRC airlift of 120 patients from Jonglei State and Greater Pibor following violence—but the source snippet lacks publication date and independent verification. Al Jazeera's July 9 article confirms ongoing intercommunal violence in Upper Nile and Jonglei as a pattern, not a new incident. Specific incident details from the last 48 hours remain limited in available open sources.
Highest-Risk Areas
Unity State (risk 35) and Central Equatoria (risk 25) drive the country's composite threat score, accounting for the vast majority of tracked risk events. All other administrative areas register at risk level 5 or below, indicating that South Sudan's security burden is geographically concentrated. Unity's volatility likely reflects ongoing inter-ethnic tensions, resource competition, and weak state capacity; Central Equatoria's elevation may reflect political sensitivity around the capital region and border proximity to Uganda. Corporate and humanitarian personnel in these two zones face materially higher exposure than in peripheral states.
How GeoBit Would Assist
OSINT & Intel Sweep against X/Twitter, Telegram, and news feeds would isolate verified 24–48-hour incidents in real time, filtering Sudan-specific events and unverified claims. Area-of-Interest (AOI) Monitoring with alerting on Unity and Central Equatoria would trigger automated notifications for conflict, intercommunal violence, and regime-stability signals, enabling rapid duty-of-care escalation for staff in those zones. Multi-language search and entity extraction would capture radio and regional media reporting often missed by English-language news aggregators, improving early warning lead time.
7-Day Outlook
No significant escalation is apparent in the current signal set, but intercommunal violence in Upper Nile and Jonglei remains a persistent baseline risk. Continued UN and EU engagement signals suggest diplomatic activity may stabilize or inflame grievances depending on messaging and local reception. Corporate teams should anticipate steady-state insecurity in high-risk zones and maintain heightened monitoring posture in Unity and Central Equatoria through the week.
Recommendation: Supply fresh incident links or social media posts from the last 48 hours for a more granular brief, or adopt a standing AOI monitoring task to detect emerging threats in real time.
Highest-Risk Areas — Ranked
| # | State / Region | Risk |
|---|---|---|
| 1 | Unity | 35 |
| 2 | Central Equatoria | 25 |
| 3 | Upper Nile | 5 |
| 4 | Northern Bahr el Ghazal | 5 |
| 5 | Western Bahr el Ghazal State | 5 |
| 6 | Ruweng Administrative Area | 5 |
| 7 | Warrap | 5 |
| 8 | Lakes | 5 |
| 9 | Jonglei | 5 |
| 10 | Greater Pibor Administrative Area | 5 |
| 11 | Western Equatoria | 5 |
| 12 | Eastern Equatoria | 5 |
Sources
Previous Daily Briefs
A new South Sudan brief is written every day — each with its own risk map and downloadable CSV. Here's the last week; use the calendar to go further back.
📅 Browse every day by calendar →
Highlighted days have a brief. Tap a day for that day's map & analysis, or “csv” for that day's dataset ($5).
Atlas — our AI intelligence desk — emails them this snapshot personally. Nothing else, no list.