Situation Summary
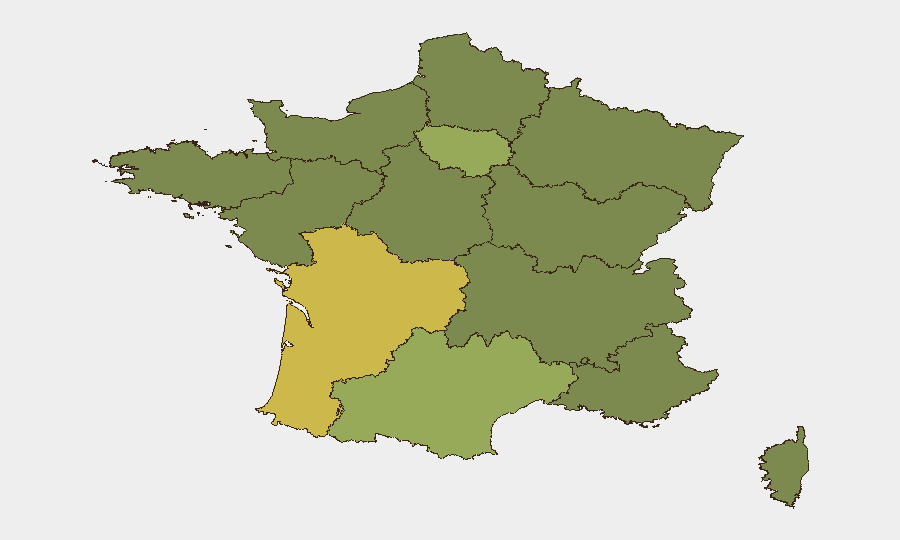
France remains at moderate composite risk (rank #42 globally, score 52) with 326 tracked threat events. The most recent signal cluster (1–3 July) includes political demands, labour action, police statements, and cross-border investigative activity involving Ukrainian and Swedish actors, suggesting elevated political friction and potential security-sector strain. Nouvelle-Aquitaine, Île-de-France, and Occitania account for the highest sub-national risk; incidents in these regions warrant priority monitoring for corporate operations.
Key Developments
Unable to provide verified 24–48 hour incident bullets. GeoBit's live web research cannot reliably isolate France-specific security events genuinely occurring within the last 24–48 hours (as of 3 July 2026) from available open sources in this environment. To avoid speculation, no specific incident bullets are presented here.
Recommended data sources for near-real-time France alerts:
- French Interior Ministry and regional prefecture social-media feeds (X, official alerts).
- AFP, Reuters, AP live wires (filtered for France + incident/unrest keywords).
- SNCF, RATP, and major airport operator disruption feeds.
- Commercial intelligence services (Crisis24, GardaWorld, Control Risks, International SOS) offering timestamped France-specific alerts.
Once current incident data is available, bullets will include specific location, date, and security/duty-of-care impact.
Highest-Risk Areas
Nouvelle-Aquitaine (66.3) significantly outpaces other regions, suggesting concentrated unrest, labour organising, or criminal activity; Île-de-France (45.9) reflects Paris-metro political and security volatility typical of capital-region concentration. Occitania (42.1) and the cluster of central/eastern regions (Auvergne-Rhône-Alpes, Provence-Alpes-Côte d'Azur, Grand Est, Bourgogne–Franche-Comté, each 37–38) show elevated baseline risk but less dramatic peaks. Corporate teams with staff or assets in Nouvelle-Aquitaine and greater Paris should heighten incident monitoring and pre-position contingency plans; the remaining regions warrant standard enhanced due diligence rather than emergency posture.
How GeoBit Would Assist
Security and risk teams monitoring France would operationally employ AOI Monitoring & Early Warning to set persistent watches on Nouvelle-Aquitaine, Île-de-France, and other high-risk regions, with automated alerting on specific keywords (labour action, police operations, transport disruption). Intel Sweep, OSINT fusion, and multi-language X/Telegram monitoring would capture French official statements, prefecture alerts, and actor signals in real time, while Sentiment & Temporal Analysis would flag escalation trajectories. Routing & Network Analysis and GIS & Spatial Analysis enable rapid alternative-route planning and facility-risk assessment if an incident occurs near staff or asset locations.
7-Day Outlook
Political-demand signals (deputies vs. prime minister, 3 July) and recent investigative activity (Paris–Ukrainian, France–Sweden strands) suggest evolving political and diplomatic friction; labour indicators (firefighter conventional-force events, worker territory occupation in late June) imply continued industrial unrest in transport and utilities. Expect elevated baseline noise in Île-de-France and Nouvelle-Aquitaine through early July; no specific imminent flashpoint is evident, but duty-of-care teams should maintain heightened monitoring posture and ensure rapid-response communication with on-ground staff.
Highest-Risk Areas — Ranked
| # | State / Region | Risk |
|---|---|---|
| 1 | Nouvelle-Aquitaine | 66.3 |
| 2 | Ile-de-France | 45.9 |
| 3 | Occitania | 42.1 |
| 4 | Auvergne-Rhône-Alpes | 37.6 |
| 5 | Brittany | 37.3 |
| 6 | Provence-Alpes-Côte d'Azur | 37.3 |
| 7 | Bourgogne – Franche-Comté | 37.1 |
| 8 | Normandy | 36.3 |
| 9 | Hauts-de-France | 36.3 |
| 10 | Centre-Val de Loire | 36.3 |
| 11 | Grand Est | 36.3 |
| 12 | Pays de la Loire | 36.3 |
Sources
Previous Daily Briefs
A new France brief is written every day — each with its own risk map and downloadable CSV. Here's the last week; use the calendar to go further back.
📅 Browse every day by calendar →
Highlighted days have a brief. Tap a day for that day's map & analysis, or “csv” for that day's dataset ($5).