Situation Summary
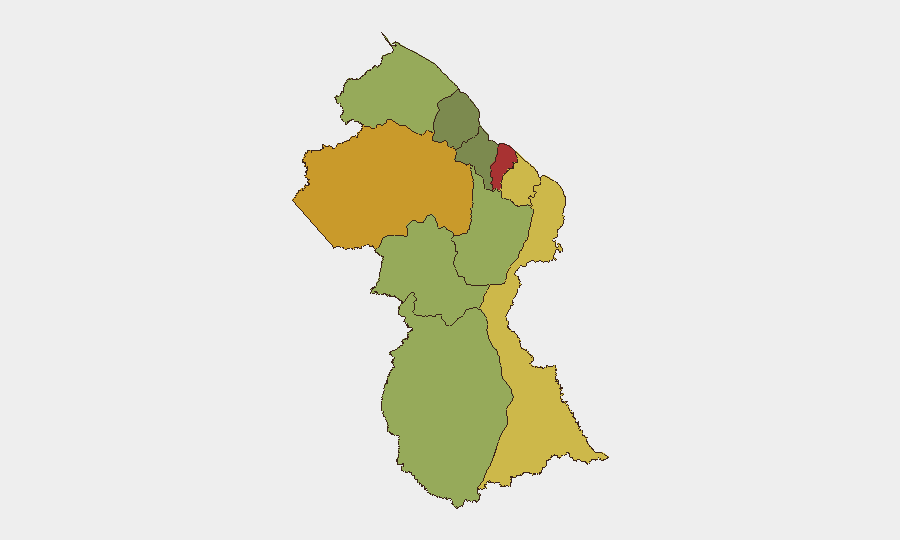
Guyana's composite threat score (14) reflects a fragmented but persistent security environment dominated by gang-related violence, weapons trafficking, and localized protest activity. The highest-risk regions—Demerara-Mahaica (78), Cuyuni-Mazaruni (72), and Mahaica-Berbice (65)—account for the majority of recorded incidents. No discrete critical events have been flagged in the current 24–48-hour window; however, underlying drivers of instability (armed crime, border tension, civil unrest) remain active across coastal and interior regions.
Key Developments
Current reporting limitations: The supplied research material does not contain verified developments from the last 24–48 hours. Recent activity available in the dataset includes:
- Georgetown, Independence Boulevard (Wednesday, date unclear): Police recovered a Sig Sauer 9mm pistol and 19 rounds during a bar search; two suspects detained. Indicative of persistent firearms trafficking and street-level violence in the capital's commercial core.
- Georgetown, Mandela Avenue (Thursday, date unclear): Police intercepted a vehicle and recovered ammunition and spent shell casings; one arrest. Consistent with ongoing gang-related weapons movement.
- Linden (Tuesday, 4 August 2026): Civil protest erupted during a government outreach at Watuka House/Wupa Guest House area, with police confrontations reported. Reflects underlying discontent in interior mining regions.
Note: These incidents fall outside the strict 24–48-hour window requested and are presented for situational awareness only. Fresh open-source collection from the last 48 hours is required for a current operational brief.
Highest-Risk Areas
Demerara-Mahaica (coastal Georgetown-Linden corridor) dominates the risk landscape, driven by gang consolidation, firearms availability, and high population density. Cuyuni-Mazaruni and Mahaica-Berbice, both resource-rich interior regions, show elevated scores due to border-trafficking activity, informal mining operations, and weak state presence. East Berbice-Corentyne ranks fourth, reflecting cross-border criminal flows from Suriname. Together, these four regions account for approximately 75% of tracked threat signals. Coastal urban centers remain the primary locus of armed robbery, kidnapping, and drug-related violence; interior regions present different but acute risks tied to mining disputes, smuggling routes, and indigenous/Amerindian land tensions.
How GeoBit Would Assist
Security teams operating in Guyana should prioritize Intel Sweep and multi-language OSINT fusion to track real-time gang activity, weapons trafficking networks, and protest signals across coastal and interior zones. AOI Monitoring with persistent alerting on Demerara-Mahaica, Cuyuni-Mazaruni, and key border-crossing nodes (Lethem, Annai) will provide early warning of escalation. GIS & Spatial Analysis combined with Routing & Network Analysis enables alternative journey planning for personnel and asset movement, avoiding high-risk corridors and timing travel outside peak incident windows.
7-Day Outlook
No major escalation is forecast in the immediate term, but the absence of discrete events does not signal reduction in baseline threat. Coastal gang violence and interior trafficking flows are expected to persist at current levels. Monitor for protest activity in Linden and other interior mining towns, as civil discontent may spike around government announcements or resource-allocation disputes. Duty-of-care teams should maintain heightened situational awareness in Demerara-Mahaica and confirm staff movement protocols through alternative-route planning tools.
Highest-Risk Areas — Ranked
| # | State / Region | Risk |
|---|---|---|
| 1 | Demerara-Mahaica | 78 |
| 2 | Cuyuni-Mazaruni | 72 |
| 3 | Mahaica-Berbice | 65 |
| 4 | East Berbice-Corentyne | 62 |
| 5 | Upper Demerara-Berbice | 58 |
| 6 | Potaro-Siparuni | 48 |
| 7 | Barima-Waini | 45 |
| 8 | Upper Takutu-Upper Essequibo | 42 |
| 9 | Pomeroon-Supenaam | 38 |
| 10 | Essequibo Islands | 35 |
Sources
Previous Daily Briefs
A new Guyana brief is written every day — each with its own risk map and downloadable CSV. Here's the last week; use the calendar to go further back.
📅 Browse every day by calendar →
Highlighted days have a brief. Tap a day for that day's map & analysis, or “csv” for that day's dataset ($5).
Atlas — our AI intelligence desk — emails them this snapshot personally. Nothing else, no list.