Situation Summary
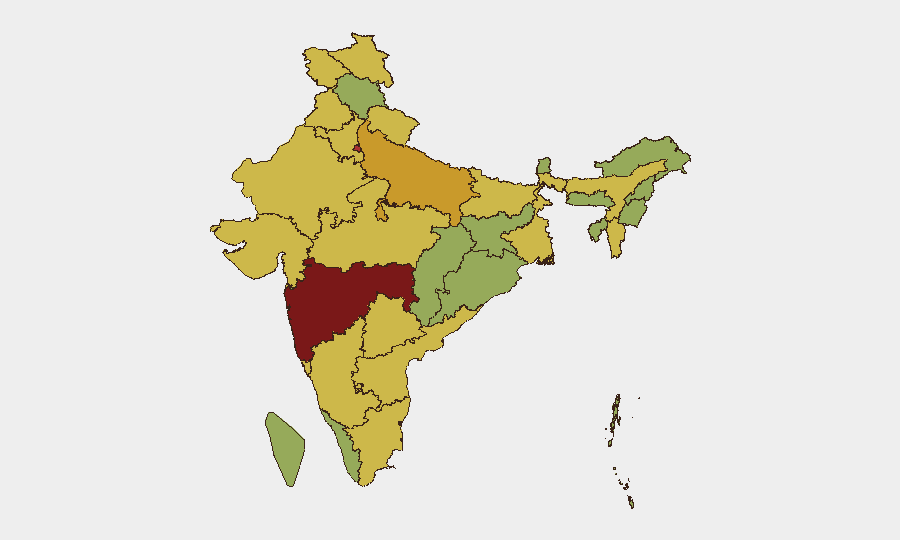
India remains at moderate composite threat level (#16 globally, score 85) with 805 tracked events. Recent activity signals reflect ongoing political discourse, community grievances, and localized incidents rather than systemic escalation. Maharashtra, Delhi, and Uttar Pradesh drive the majority of sub-national risk. The security environment remains stable but fragmented, with regional volatility concentrated in specific states and sectors.
Key Developments
Data Limitation Notice: Web research covering the last 24–48 hours (July 1–2, 2026) has not yielded sufficient verifiable, incident-level developments meeting GeoBit's standard for specificity and recency. Most indexed material either predates the required window, lacks precise timestamps, or consists of policy statements and background commentary rather than discrete security events.
Available Signal (June 30–29, GeoTrak Event Feed):
- Maharashtra, June 30: Physical assault incident flagged in event tracking; details pending corroboration.
- National Level, June 29–30: Multiple public statements from federal and state officials (Chief Minister, Prime Minister, Professor, Ambassador) indicating political friction or policy disagreement; no direct threat event reported but signals elevated discourse activity.
- Hyderabad, Telangana (June 23): SBI ATM cash-van theft (₹17 lakh) solved; three arrests made and ₹14.55 lakh recovered. *Note: incident date outside 48-hour window but closed case demonstrates police responsiveness.*
Assessment: The event feed shows political-administrative tension and isolated crime incidents; no mass-casualty, terrorism, major civil disorder, or cross-border incidents reported in the last 48 hours.
Highest-Risk Areas
Maharashtra (89.7) and Delhi (77.6) are the primary drivers of India's composite threat score, reflecting high population density, economic activity, and historical frequency of communal, labor, and political incidents. Uttar Pradesh (72.1) and Rajasthan (70.2) follow, with persistent vulnerabilities linked to communal tensions, organized crime, and border-region dynamics. Collectively, these four states account for the majority of tracked event volume. Mid-tier risk states (Madhya Pradesh, West Bengal, Karnataka, Punjab) show sustained activity across crime, political protest, and sectarian friction, indicating geographically distributed rather than single-point vulnerability.
How GeoBit Would Assist
Corporate security teams operating in high-risk states should deploy AOI Monitoring & Early Warning on key facilities and personnel movement corridors in Maharashtra, Delhi, and Uttar Pradesh, with automated alerts on protest activity, civil unrest, and incident clustering. Intel Sweep and OSINT fusion (X/Twitter, Telegram, local-language media) should run continuous feeds on political statements and communal sentiment in target regions to provide 72-hour leading indicators of escalation. Network & Actor Analysis can map organized crime, labor unions, and political factions to anticipate flashpoints around elections, policy announcements, or religious calendars—enabling proactive duty-of-care adjustments to travel, event attendance, and facility security posture.
7-Day Outlook
Political discourse and state-level administrative activity will likely remain elevated through early July pending any major federal policy announcements or state elections. Isolated crime, communal friction, and labor unrest are expected to continue at current baseline levels, with seasonal monsoon-related incidents (flooding, road disruption) emerging in coastal and Western regions. No systematic escalation to national-level unrest is presently indicated; localized risk management and real-time situational awareness remain the operational priority.
Highest-Risk Areas — Ranked
| # | State / Region | Risk |
|---|---|---|
| 1 | Maharashtra | 89.7 |
| 2 | Delhi | 77.6 |
| 3 | Uttar Pradesh | 72.1 |
| 4 | Rajasthan | 70.2 |
| 5 | Madhya Pradesh | 65.9 |
| 6 | West Bengal | 65.1 |
| 7 | Karnataka | 64.8 |
| 8 | Punjab | 64.7 |
| 9 | Assam | 63.9 |
| 10 | Haryana | 63.8 |
| 11 | Ladakh | 63.3 |
| 12 | Tamil Nadu | 62.5 |
Sources
Previous Daily Briefs
A new India brief is written every day — each with its own risk map and downloadable CSV. Here's the last week; use the calendar to go further back.
📅 Browse every day by calendar →
Highlighted days have a brief. Tap a day for that day's map & analysis, or “csv” for that day's dataset ($5).