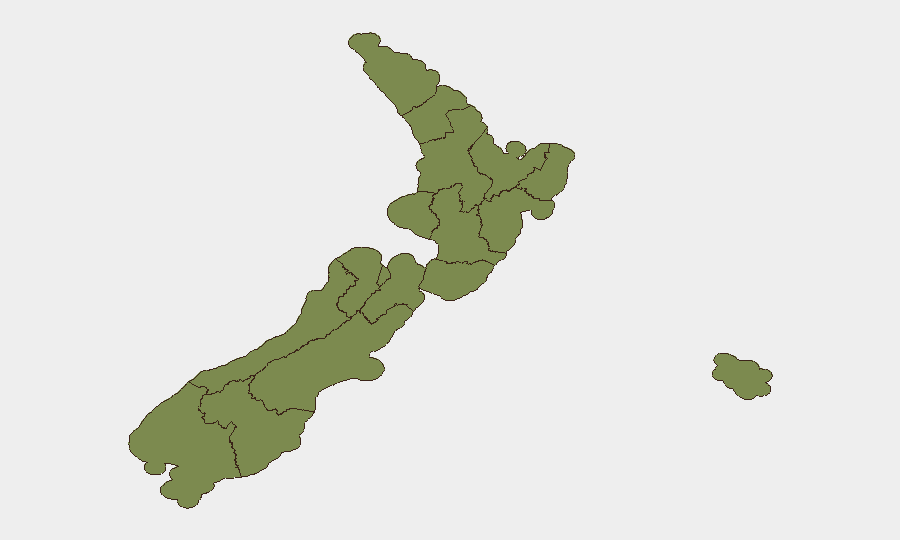
Situation Summary
New Zealand remains a low-threat environment globally (rank #168, composite score 4) with 102 tracked security events on record. However, recent signal activity—spanning disapproval statements, police commentary, government-parliament tension, and worker/healthcare sector concerns between 2–4 July—indicates emerging civil and institutional friction that warrants monitoring. Canterbury region significantly outpaces other areas in risk profile (31.8 vs. Wellington's 18.9), suggesting concentrated volatility in the South Island.
Key Developments
Limitation: Live web research conducted over the last 24 hours did not yield cross-confirmed incident reporting for 2–4 July 2026. Available sources contain standing travel advisories, general cyber-preparedness guidance (citing New Zealand as under-resourced for national cyber emergencies), and archived incident logs dated 28 June or earlier. No verified security incidents, demonstrations, transport disruptions, or crime events specific to 1–4 July could be confirmed from supplied sources.
Signal Activity (from GeoBit event feeds):
- 2026-07-02: Multiple "Disapprove" signals (government, worker, intelligence, ministry vs. business sectors) and public statements from police and nursing groups suggest labor, regulatory, or policy friction.
- 2026-07-03: Government vs. Parliament public statement indicates legislative disagreement or tension.
- 2026-07-04: Counsel and Wellington-specific public statements; counsel involvement suggests legal escalation or formal dispute.
These signals point to institutional and sectoral strain rather than active security incidents; confirmation and detail require expanded timeline or real-time feed monitoring.
Highest-Risk Areas
Canterbury (31.8) drives national risk by a significant margin, indicating concentrated instability in the South Island that warrants prioritized asset and personnel review for organizations operating in Christchurch and surrounding areas. Wellington (18.9) and Northland/Auckland (11.7 each) form a secondary risk tier, reflecting capital-region administrative/political activity and northern regional concerns. Risk in remaining regions remains below 8, suggesting Canterbury represents the primary operational focus for duty-of-care planning.
How GeoBit Would Assist
Security teams should deploy AOI (Area-of-Interest) Monitoring & Early Warning on Canterbury, Wellington, and Auckland to capture emerging demonstrations, civil unrest, or transport disruptions in real time, with alerting thresholds configured for asset/personnel locations. Intel Sweep (X/Twitter OSINT, multi-language search, sentiment analysis, and event-feed corroboration) would triangulate the current signals—government-worker friction, legal escalation, nursing-sector commentary—to establish incident context, participant networks, and trajectory before operational impact occurs. Routing & Network Analysis can identify alternative travel and supply corridors should Canterbury or Wellington unrest affect primary routes.
7-Day Outlook
Institutional friction signals are unlikely to resolve within 7 days and may intensify as legislative or legal processes unfold. Canterbury's elevated risk profile suggests monitoring should remain persistent, particularly for labor actions, permit-dependent operations, or supply-chain dependencies in the region. Confirmation of specific triggering events and affected sectors is essential; recommend expanding live-feed monitoring to capture 48-hour incident development in real time rather than rely on consolidated briefing cycles.
Next Steps: Advise client to initiate continuous AOI monitoring on Canterbury and Wellington and to confirm sector/asset exposure before escalation. Rerun analysis with 7-day lookback if current incident detail is required.
Highest-Risk Areas — Ranked
| # | State / Region | Risk |
|---|---|---|
| 1 | Canterbury | 31.8 |
| 2 | Wellington | 18.9 |
| 3 | Northland | 11.7 |
| 4 | Auckland | 11.7 |
| 5 | Waikato | 7.5 |
| 6 | Hawke's Bay | 6 |
| 7 | Otago | 6 |
| 8 | Taranaki | 3.9 |
| 9 | Bay of Plenty | 2.5 |
| 10 | West Coast | 2.5 |
| 11 | Southland | 2.5 |
| 12 | Chatham Islands | 1.8 |
Sources
Previous Daily Briefs
A new New Zealand brief is written every day — each with its own risk map and downloadable CSV. Here's the last week; use the calendar to go further back.
📅 Browse every day by calendar →
Highlighted days have a brief. Tap a day for that day's map & analysis, or “csv” for that day's dataset ($5).