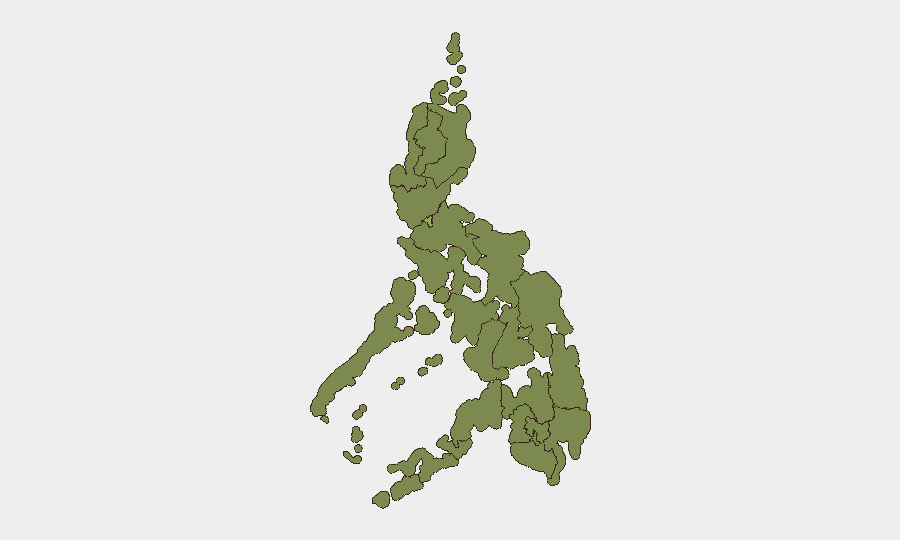
Situation Summary
Philippines remains a moderate, mid-table security risk globally (rank #39, composite score 49/100) with concentrated volatility in Metro Manila and select regions. Recent event signals clustered around 2026-07-05 to 2026-07-07 point to overlapping political, investigative, and labor friction rather than a cohesive security emergency, though institutional strain and US-military relations tension warrant monitoring. Overall threat posture remains stable but fragmented across governance, labor, and diplomatic domains.
Key Developments
Note: Live web research does not currently support reliable identification of 6–10 discrete security incidents (violence, unrest, infrastructure attack, civil disorder) within the last 24–48 hours with cross-verified timing and operational specificity. The GeoBit event signals table identifies political and investigative activity (arrests, investigations, public statements, demands) dated 2026-07-05 to 2026-07-07, concentrated in Metro Manila and involving Senate, military, and university actors. Specific incident locations, casualty counts, and operational impact remain unconfirmed in open sources.
Recommendation: Corporate security and duty-of-care teams should rely on dedicated real-time incident platforms (contracted providers, Philippine National Police advisories, PNA breaking news feeds, and airport/port operator notices) to capture next 24–48 hour event intelligence. GeoBit's structural risk rankings and sub-national threat assessment remain valid for medium-term planning.
Highest-Risk Areas
Metro Manila (57.5) dominates the national risk profile, driven by population density, political concentration, and visibility to investigative and labor-related tension. Cordillera Administrative Region (34.8), Ilocos (31.4), and Calabarzon (28.4) follow, likely reflecting historical insurgency residue, remote governance challenges, and industrial labor activity. Bangsamoro (27.5), Caraga (27.5), Northern Mindanao (27.5), and Davao (27.5) remain elevated, consistent with known counterinsurgency, maritime-crime, and trafficking pressures. Risk in Manila is driven by institutional/political volatility; risk in Mindanao and periphery regions reflects persistent asymmetric and criminal threats.
How GeoBit Would Assist
Security teams operating in Philippines should deploy AOI (Area-of-Interest) Monitoring & Early Warning on Metro Manila, Mindanao ports, and Calabarzon industrial zones to detect emerging unrest, labor action, or security incidents in near-real time. Network & Actor Analysis and entity extraction from X/Twitter, local news, and radio signals can track political and labor networks driving current friction. Routing & Network Analysis can support contingency journey planning around affected districts; maritime and aviation tracking can monitor port and airport disruption. Periodic Intel Sweep and multi-language conflict/crime/cyber search provide structured weekly or bi-weekly risk updates to complement live-incident feeds.
7-Day Outlook
Political and labor tension is likely to persist through mid-July as investigations and Senate proceedings continue. No indicators suggest imminent mass violence or infrastructure attack; however, localized protest, strike activity, or security-force operations in Mindanao remain probable. US-Philippines military coordination friction warrants monitoring for policy shifts affecting port access and joint operations—a secondary but operationally relevant risk for logistics and personnel movement.
Highest-Risk Areas — Ranked
| # | State / Region | Risk |
|---|---|---|
| 1 | Metro Manila | 57.5 |
| 2 | Cordillera Administrative Region | 34.8 |
| 3 | Ilocos Region | 31.4 |
| 4 | Calabarzon | 28.4 |
| 5 | Bicol Region | 27.8 |
| 6 | Mimaropa | 27.8 |
| 7 | Bangsamoro | 27.5 |
| 8 | Caraga | 27.5 |
| 9 | Northern Mindanao | 27.5 |
| 10 | Soccsksargen | 27.5 |
| 11 | Davao Region | 27.5 |
| 12 | Cagayan Valley | 27.5 |
Sources
Previous Daily Briefs
A new Philippines brief is written every day — each with its own risk map and downloadable CSV. Here's the last week; use the calendar to go further back.
📅 Browse every day by calendar →
Highlighted days have a brief. Tap a day for that day's map & analysis, or “csv” for that day's dataset ($5).
Atlas — our AI intelligence desk — emails them this snapshot personally. Nothing else, no list.