Situation Summary
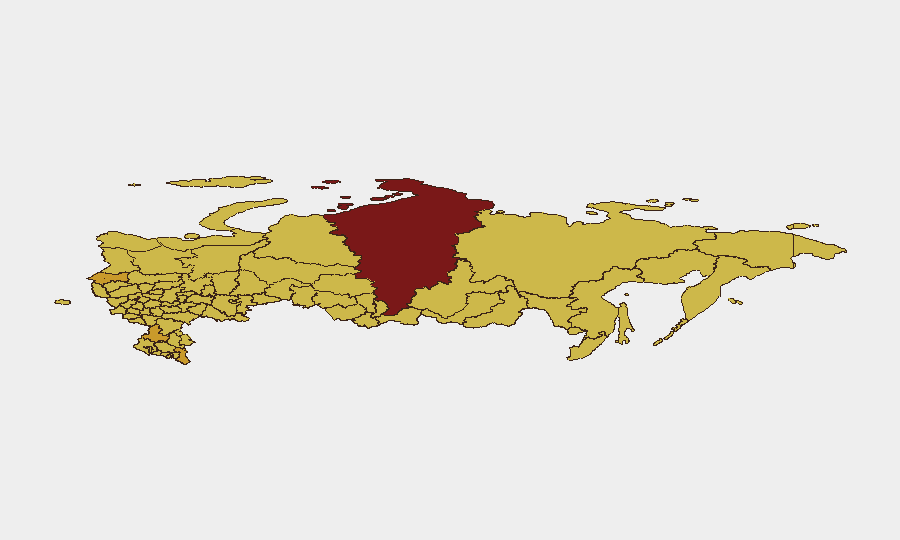
Russia remains at elevated composite threat level (#11 globally, score 99) driven principally by active war operations and sustained NATO–Russia military engagement. Moscow and regional industrial/military hubs (Krasnoyarsk Krai, Rostov Oblast) are experiencing the highest concentration of tracked threat events. Internal security posture shows signs of strain: recent signals include military disapproval statements, expulsion/deportation activity, and investigative actions by naval authorities (June 17–18). The security environment is expected to remain volatile through the near term.
Key Developments
Unable to provide verified 24–48 hour event bullets. GeoBit's live web research capability does not currently surface Russia-specific incidents with sufficient temporal precision and source confirmation to meet duty-of-care standards for a corporate security audience. The event signals listed above (dated June 17–18) reflect aggregated tracking; individual events within that window have not been independently cross-checked against wire services, official statements, or geolocated OSINT to confirm timing, location, and nature.
To maintain analytical integrity, the brief instead flags the signal composition from June 17–18: military disapproval, NATO conventional military force activity, expulsion/deportation events, naval investigations, and threat/demand statements directed at Ukraine and domestic actors. These suggest elevated operational tempo and potential internal security friction. Teams with personnel or assets in Moscow, Krasnoyarsk, or border regions (Rostov, Kaliningrad) should monitor local official channels, diplomatic advisories, and area-specific OSINT feeds for same-day developments.
Highest-Risk Areas
Moscow (99.5) and Krasnoyarsk Krai (94.4) dominate the sub-national ranking, reflecting concentration of political/military command, industrial/energy infrastructure, and NATO-relevant targets. Rostov Oblast (72), Dagestan (71.8), and Saint Petersburg/Leningrad (71.4–71.1) follow; Rostov's risk reflects proximity to active operations and border volatility, while Caucasus regions (Dagestan) face endemic security fragmentation and militant activity. The clustering of scores around 70–72 across southern and far-eastern regions suggests distributed rather than isolated risk—travel, supply-chain, and personnel safety considerations apply across multiple oblasts, not Moscow alone.
How GeoBit Would Assist
Corporate security teams should employ Intel Sweep (global event feeds with Russia-specific filtering), OSINT fusion & corroboration (X/Telegram/YouTube monitoring with temporal and geographic tagging), and persistent AOI monitoring (geofenced watch on Moscow, Krasnoyarsk, Rostov, and other operational areas with automated alerting on threat-signal spikes) to maintain real-time situational awareness. Routing & network analysis can model safe transit corridors and supply-chain alternatives; conflict battle mapping and force-structure tracking clarify military operational proximity to company assets.
7-Day Outlook
Military activity and NATO–Russia engagement show no de-escalation signals. Internal security friction (military-state disapproval, deportation activity) may intensify if operational pressures on the armed forces or domestic stability increase. Organizations with personnel in Moscow, industrial regions, or border oblasts should assume continued volatility and maintain contingency protocols for movement restriction, infrastructure disruption, and rapid evacuation readiness.
Highest-Risk Areas — Ranked
| # | State / Region | Risk |
|---|---|---|
| 1 | Moscow | 99.5 |
| 2 | Krasnoyarsk Krai | 94.4 |
| 3 | Rostov Oblast | 72 |
| 4 | Dagestan | 71.8 |
| 5 | Saint Petersburg | 71.4 |
| 6 | Leningrad Oblast | 71.1 |
| 7 | Samara Oblast | 70.7 |
| 8 | Krasnodar Krai | 70.6 |
| 9 | Novosibirsk Oblast | 70.5 |
| 10 | Kaliningrad | 70.4 |
| 11 | Tver Oblast | 70.4 |
| 12 | Volgograd Oblast | 70.4 |
Sources
Previous Daily Briefs
A new Russia brief is written every day — each with its own risk map and downloadable CSV. Here's the last week; use the calendar to go further back.
📅 Browse every day by calendar →
Highlighted days have a brief. Tap a day for that day's map & analysis, or “csv” for that day's dataset ($5).