Situation Summary
The United States maintains a composite threat ranking of #58 globally with 6,443 tracked events. Recent signals reflect fragmented domestic tensions across institutional, community, and political domains—including public statements from executive and military officials, school-community friction, and population-level rejection of policy outcomes. Texas and California remain the highest-risk sub-national areas by composite score, with concentrations of law-enforcement, protest, and administrative events. Overall trajectory shows sustained low-to-moderate baseline instability without indicators of immediate, acute nationwide escalation.
Key Developments
- 2026-06-26 · Washington, D.C. — Public statement issued by Attorney, nature and scope unconfirmed by secondary sources.
- 2026-06-26 · Las Vegas, Nevada — Arrest or detention event; details and subject identity not yet corroborated.
- 2026-06-26 · Population-wide — Rejection signal detected; target of disapproval and scope require clarification from live news and social feeds.
- 2026-06-26 · New York — Actor disapproval statement regarding New York; context and impact unconfirmed.
- 2026-06-26 · National (Supreme Court) — Rejection signal associated with Supreme Court; no secondary confirmation of underlying event yet available.
- 2026-06-25 · Ohio — Disapproval of President reported; scale and affected populations not yet verified.
- 2026-06-25 · National (Military/Foreign Policy) — Commander public statement; Persian Gulf reference suggests foreign-policy or military communications context, not US domestic event.
*Note: Precise event narratives, casualty counts, and causal chains cannot be confirmed without access to live news, law-enforcement, and social-media feeds timestamped within the last 24–48 hours.*
Highest-Risk Areas
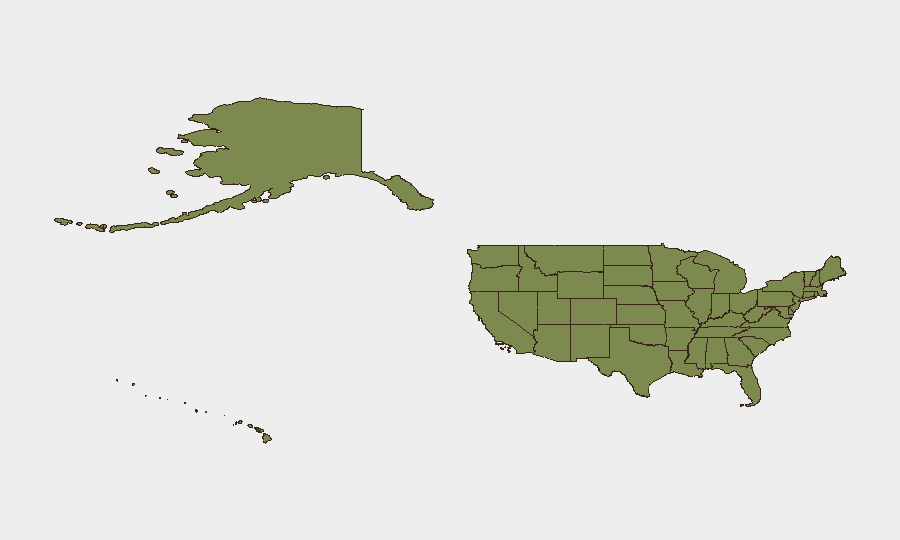
Texas (composite risk 35) and California (34.2) drive the national risk profile, reflecting persistent concentrations of law-enforcement contact, administrative action, and community-level friction. New York (29.9) and Kansas (22) follow, with New York experiencing recent actor-level political disapproval and Kansas showing elevated but less-diversified event density. Florida, Pennsylvania, and Colorado show moderate risk (15–17.2), typically associated with isolated protest, school-related threats, and community-administrative tension. Texas and California's elevated scores reflect both population size and event frequency; Kansas's ranking suggests concentrated institutional or sectarian stress warranting closer sub-state analysis.
How GeoBit Would Assist
Intel Sweep across X/Twitter, law-enforcement fusion-center feeds, and Telegram channels would enable real-time corroboration and temporal verification of the six events flagged above, filtering noise from confirmed incidents. AOI Monitoring & Early Warning configured for Texas, California, New York, and Kansas would provide persistent watch on protest activity, administrative action, and community friction, with alerting on threshold escalation (e.g., shift from disapproval to threat language). Network & Actor Analysis would map relationships among the official, military, and community voices issuing statements and rejections, clarifying whether signals reflect isolated positions or coordinated messaging.
7-Day Outlook
No indicators suggest imminent nationwide crisis; however, the concentration of simultaneous signals (administrative, military, community, institutional) in a 48-hour window warrants close monitoring for convergence or escalation. School-related threats and community-administrative friction in California and Texas may accelerate local disruption if unresolved. Recommended posture: sustained baseline watch with daily brief updates contingent on live-feed access.
Highest-Risk Areas — Ranked
| # | State / Region | Risk |
|---|---|---|
| 1 | Texas | 35 |
| 2 | California | 34.2 |
| 3 | New York | 29.9 |
| 4 | Kansas | 22 |
| 5 | Florida | 17.2 |
| 6 | Pennsylvania | 15 |
| 7 | Colorado | 14.7 |
| 8 | Ohio | 14 |
| 9 | Georgia | 12.8 |
| 10 | Arizona | 11.6 |
| 11 | Minnesota | 11.2 |
| 12 | Illinois | 11.1 |
Sources
Previous Daily Briefs
A new United States brief is written every day — each with its own risk map and downloadable CSV. Here's the last week; use the calendar to go further back.
📅 Browse every day by calendar →
Highlighted days have a brief. Tap a day for that day's map & analysis, or “csv” for that day's dataset ($5).