Situation Summary
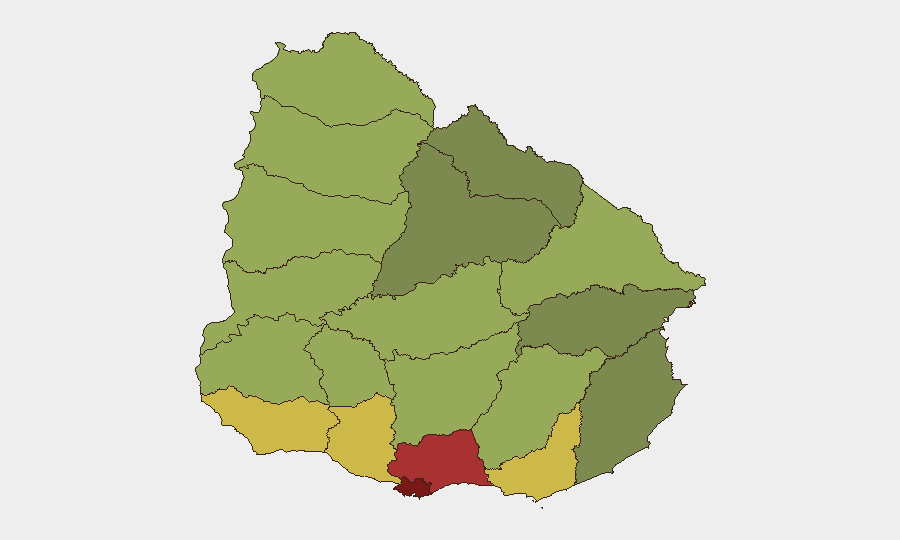
Uruguay remains a low-threat environment globally (#157, composite score 5) with no confirmed civil unrest, armed conflict, or mass-casualty incidents in the last 24–48 hours. Current intelligence lacks time-stamped, independently corroborated evidence of specific security events meeting operational briefing standards, though signal traffic in recent days includes unverified reports of small-arms activity and diplomatic friction that require local verification. The country's overall security posture remains stable, but regional variance—particularly elevated risk in Montevideo and Canelones—warrants targeted monitoring of high-density urban areas.
Key Developments
- No verified incidents confirmed in last 24–48 hours. Open-source feeds and regional wires have not corroborated specific, time-stamped security events meeting multi-source OSINT standards for Uruguay in this window. Claims of small-arms activity and institutional disputes circulate in signal traffic but lack precise geolocation, independent confirmation, or actionable detail.
- Diplomatic/institutional friction flagged (June 28–30). Government, ministerial, and parliamentary statements and disapprovals were recorded; Paraguay issued a public statement toward Uruguay on June 30. These signals suggest political tension but do not indicate imminent security escalation or civil unrest.
- Durazno department noted as relative structural outlier. Risk assessment data flags Durazno with elevated composite risk (31.4 vs. 1.4 average) but attributes this to underlying conditions rather than acute incidents. Local on-the-ground verification is recommended to understand drivers.
- No infrastructure, travel, or crime-wave alerts issued. Current monitoring reports no disruption to transportation, utilities, or supply chains, and no mass-casualty or organized-crime events reported nationwide.
Highest-Risk Areas
Montevideo (risk 92) and Canelones (risk 78) drive the national risk profile, reflecting concentration of population, economic activity, and historically higher rates of petty crime, robbery, and gang-affiliated violence in urban neighborhoods. Maldonado (68) and San José (64) present secondary concern, likely tied to tourism density, border proximity, and cross-border criminal movement. Risk scores in these departments are structural rather than event-driven; teams should apply standard urban-security protocols (situational awareness, restricted movement in high-crime neighborhoods after dark, secure transport) rather than assume acute threat escalation.
How GeoBit Would Assist
Teams operating in Uruguay would use AOI Monitoring & Early Warning on Montevideo and Canelones departments to detect upticks in civil unrest, police action, or criminal activity in near-real-time; Intel Sweep and OSINT fusion (X/Twitter, Telegram, regional wires, multi-language sources) to corroborate claims of armed activity or institutional crises before they escalate; and Network & Actor Analysis to map organized-crime or gang movements that cross departmental borders. GIS & Spatial Analysis would support alternative routing and movement planning to avoid highest-risk neighborhoods during operational hours.
7-Day Outlook
Near-term trajectory is stable. Diplomatic friction and institutional disagreement appear contained to official channels; no indicators suggest spillover into street-level unrest or security-force escalation. Standard duty-of-care protocols for Montevideo and Canelones remain appropriate; no change in travel or operational posture is warranted unless corroborated local reporting of mass civil unrest or armed violence emerges.
Highest-Risk Areas — Ranked
| # | State / Region | Risk |
|---|---|---|
| 1 | Montevideo | 92 |
| 2 | Canelones | 78 |
| 3 | Maldonado | 68 |
| 4 | San José | 64 |
| 5 | Colonia | 62 |
| 6 | Soriano | 58 |
| 7 | Río Negro | 56 |
| 8 | Salto | 54 |
| 9 | Artigas | 52 |
| 10 | Paysandú | 50 |
| 11 | Florida | 48 |
| 12 | Flores | 46 |
Sources
Previous Daily Briefs
A new Uruguay brief is written every day — each with its own risk map and downloadable CSV. Here's the last week; use the calendar to go further back.
📅 Browse every day by calendar →
Highlighted days have a brief. Tap a day for that day's map & analysis, or “csv” for that day's dataset ($5).