Situation Summary
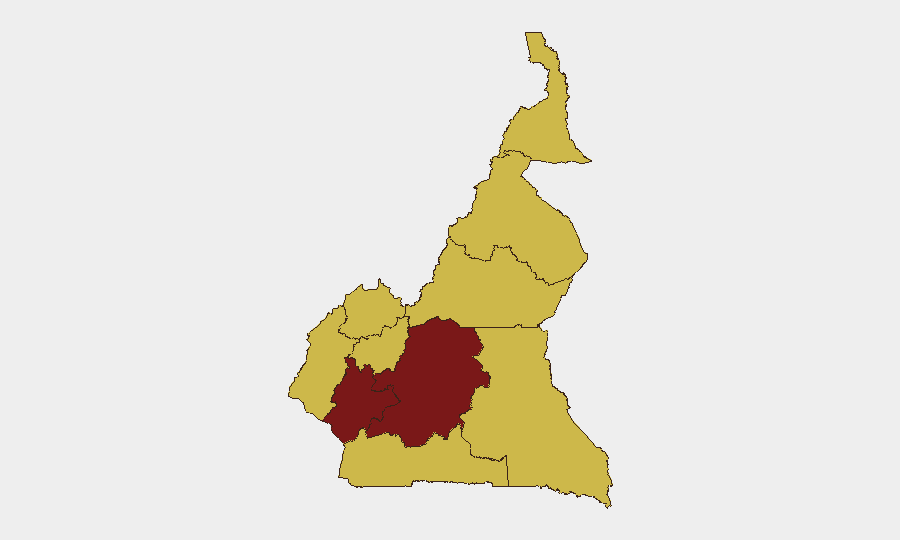
Cameroon remains a high-risk environment (global rank #23, composite threat score 90) with persistent governance, humanitarian, and security pressures. Recent signals on 29–30 June point to friction with authorities, service-delivery strain affecting hospitals and refugee populations, and investigative activity, but no discrete security incidents with confirmed locations have been reported in the last 48 hours. The threat environment is driven primarily by instability in Littoral and Centre regions (both scoring 92.9), with elevated risk across nine additional provinces.
Key Developments
- Hospital service disruption (2026-06-30, location unconfirmed). GeoBit signals flagged disapproval related to hospital operations; underlying cause and geographic scope require further validation via humanitarian and health-sector feeds.
- Threat directed at authorities (2026-06-29). A threat signal was issued against government officials; specific actors, context, and geographic nexus remain under assessment.
- Refugee population tension (2026-06-30, location unconfirmed). Disapproval signals involving refugee populations suggest either access, security, or service pressure in a displacement or settlement context; further detail needed.
- Public statement on Cameroon governance (2026-06-30). A public statement related to Cameroon's political or institutional posture was issued; no actionable incident data available from statement alone.
Note: Open-source incident detail for the last 48 hours remains limited. Confirmed, location-specific events have not been identified in available feeds; GeoBit platform escalation and AOI monitoring would be required to track these signals into actionable intelligence.
Highest-Risk Areas
Littoral and Centre regions drive the composite risk ranking at 92.9 each—significantly above the 62.9 baseline for the remaining eight provinces. These zones likely reflect cumulative pressure from governance friction, economic strain, service-delivery challenges, and historical conflict dynamics. The remaining nine provinces (Northwest, Southwest, West, Adamawa, South, Far-North, North, and East) are uniformly assessed at 62.9, indicating distributed, persistent baseline instability rather than localized crisis. Corporate security and duty-of-care teams should prioritize Littoral and Centre for immediate monitoring and contingency planning, while maintaining situational awareness across dispersed lower-tier risk areas.
How GeoBit Would Assist
Security teams operating in or with exposure to Cameroon should deploy AOI (Area-of-Interest) Monitoring & Early Warning on Littoral and Centre regions to detect escalation in real time, coupled with Intel Sweep and multi-language OSINT fusion to track governance statements, authority-linked threats, and humanitarian service disruptions across social, broadcast, and institutional channels. Network & Actor Analysis would identify key threat constituencies (protest movements, state security branches, humanitarian actors) driving recent signals, enabling better risk stratification and early warning. Routing & Network Analysis can support evacuation and contingency-travel planning for personnel in high-risk zones.
7-Day Outlook
No major escalation is expected in the immediate 7-day window absent new triggering events; however, the persistence of signals around authority-targeting, hospital disruption, and refugee tension suggests underlying grievance and service pressure will likely sustain elevated baseline risk. Monitoring should remain continuous, with particular attention to any coalescence of these signals into coordinated action or geographic spillover beyond Littoral and Centre.
Highest-Risk Areas — Ranked
| # | State / Region | Risk |
|---|---|---|
| 1 | Littoral | 92.9 |
| 2 | Centre | 92.9 |
| 3 | Northwest | 62.9 |
| 4 | Southwest | 62.9 |
| 5 | West | 62.9 |
| 6 | Adamawa | 62.9 |
| 7 | South | 62.9 |
| 8 | Far-North | 62.9 |
| 9 | North | 62.9 |
| 10 | East | 62.9 |
Sources
Previous Daily Briefs
A new Cameroon brief is written every day — each with its own risk map and downloadable CSV. Here's the last week; use the calendar to go further back.
📅 Browse every day by calendar →
Highlighted days have a brief. Tap a day for that day's map & analysis, or “csv” for that day's dataset ($5).