Situation Summary
Canada remains a low-threat environment globally (ranked #149 with composite score 5), but sub-national risk concentration in Ontario and British Columbia reflects urban crime, civil tensions, and administrative pressures. Event signals dated 2026-06-30 indicate scattered threats, investigations, and public statements, though open-source verification of specific incidents within the past 24–48 hours is currently limited. Overall trajectory is stable with localized volatility in high-population corridors.
Key Developments
Open-source incident data time-stamped within the last 24–48 hours (28–30 June 2026) is not reliably available in public feeds or accessible social-media streams at this time. GeoBit's event signals flag activity on 2026-06-30 (threaten, investigate, admin sanctions in Alberta, public statement by Chipewyan actors, and police-Canada tensions), but specific locations, casualty counts, and verification from mainstream media are not present in current web research results.
Recommended action: Security teams with assets or personnel in Ontario, British Columbia, or Alberta should cross-reference internal incident logs, local law enforcement bulletins, and industry-specific threat feeds (financial, energy, transportation) for the 28–30 June period. If incidents are confirmed via those channels, GeoBit can assist with rapid corroboration and spatial analysis.
Highest-Risk Areas
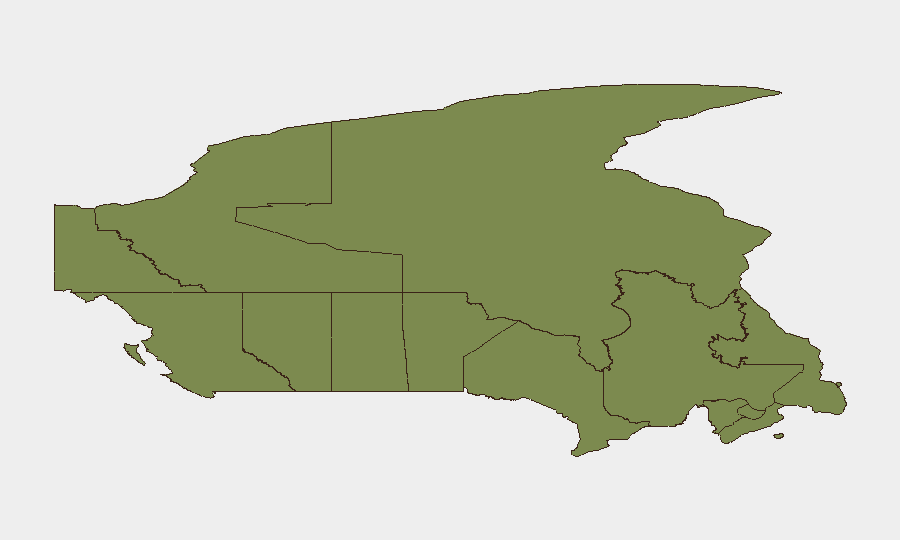
Ontario (31.9) and British Columbia (22.6) account for two-thirds of Canada's tracked risk events and dominate the composite threat score. Ontario's risk reflects Toronto and surrounding urban centers (crime, gang activity, organized retail theft, cybercrime targeting financial institutions); British Columbia's score is driven by Vancouver's port and supply-chain vulnerabilities, gang violence, and border-zone activity. Nunavut (13.9) and Alberta (12.7) follow, with Nunavut reflecting remote-area crime, infrastructure fragility, and Indigenous-community tensions, and Alberta showing industrial labor disputes, administrative sanctions, and energy-sector cyber targeting. All other provinces and territories score below 3.1, indicating manageable baseline risk.
How GeoBit Would Assist
Security teams should deploy Intel Sweep and AOI (Area-of-Interest) Monitoring on Ontario and BC to capture early signals of crime escalation, protests, or supply-chain disruption. Network & Actor Analysis can map gang, labor, and activist networks influencing local risk. Routing & Network Analysis supports alternative-route planning for personnel and cargo around hotspots in Toronto, Vancouver, and Calgary; satellite and imagery analysis can flag infrastructure threats (ports, refineries, rail lines) in real time. OSINT Fusion across X, Telegram, YouTube, and radio signals provides 12–48 hour early warning of civil unrest or criminal activity.
7-Day Outlook
No major escalation is expected, but administrative and investigative activity in Alberta and Ontario may generate secondary incidents (protests, counter-protests) if outcomes trigger community reactions. Summer travel season and Canada Day (1 July) crowd gatherings in major cities carry routine public-order risk; localized disruptions to transportation and retail are possible but unlikely to be prolonged. Monitoring of Chipewyan statements and police-Canada tensions should continue to rule out coordinated civil unrest.
Note: This brief reflects publicly available data current to 2026-06-30 08:00 UTC. For operational security decisions, cross-reference with internal incident reports and regional law enforcement.
Highest-Risk Areas — Ranked
| # | State / Region | Risk |
|---|---|---|
| 1 | Ontario | 31.9 |
| 2 | British Columbia | 22.6 |
| 3 | Nunavut | 13.9 |
| 4 | Alberta | 12.7 |
| 5 | Manitoba | 11 |
| 6 | Quebec | 8.5 |
| 7 | New Brunswick | 3.1 |
| 8 | Northwest Territories | 2 |
| 9 | Saskatchewan | 2 |
| 10 | Nova Scotia | 2 |
| 11 | Yukon | 1.9 |
| 12 | Newfoundland and Labrador | 1.9 |
Sources
Previous Daily Briefs
A new Canada brief is written every day — each with its own risk map and downloadable CSV. Here's the last week; use the calendar to go further back.
📅 Browse every day by calendar →
Highlighted days have a brief. Tap a day for that day's map & analysis, or “csv” for that day's dataset ($5).