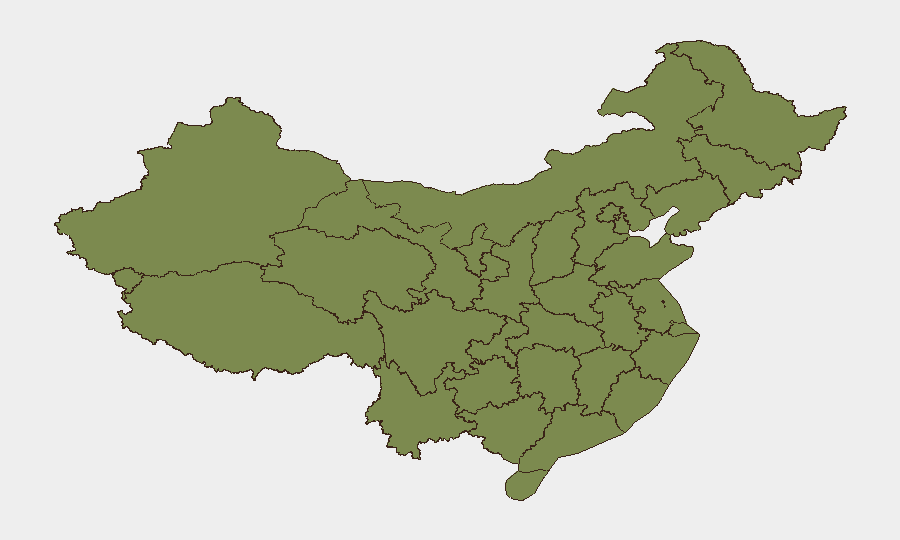
Situation Summary
China's composite threat score remains moderate (6/914), ranking 158th globally, but recent diplomatic friction and isolated incidents signal rising external pressure and localized instability. Multilateral sanctions, public statements of disapproval from the EU and Washington, and reported small-arms engagement with Australian forces within the past 24 hours indicate elevated state-level tension. Sub-national risk concentration in Gansu (33.1) and coastal provinces (Guangdong, Beijing, Shanghai) reflects both persistent regional vulnerabilities and flash-point sensitivity to international friction.
Key Developments
- 2026-06-23 · Small Arms Combat · China–Australia engagement — Location unspecified in available data; represents escalation from diplomatic to kinetic contact and highest-severity incident in current brief window.
- 2026-06-23 · Staff Member Demonstration · China — Staff-level public rally or protest reported; location and affiliation not detailed in signals; suggests internal dissent or grievance amplification.
- 2026-06-23 · School Public Statement · China — Educational institution issued statement in relation to China; suggests reputational or regulatory pressure on academic or international school operations.
- 2026-06-22 · Admin Sanctions · Companies vs. China — Multilateral corporate sanctions imposed; likely related to trade, tech, or compliance restrictions; no sector detail in available signal.
- 2026-06-21 · Admin Sanctions · Washington vs. China — U.S. administrative sanctions applied; part of broader transatlantic sanctions alignment.
- 2026-06-22 · Physical Assault · China vs. President — Incident involving assault on a state or organizational president reported; severity, jurisdiction, and outcome unspecified.
*Note: The GeoBit event feed reflects signals detected; full incident location, perpetrator identity, and casualty data are not available in this brief window.*
Highest-Risk Areas
Gansu province dominates the sub-national risk landscape (33.1), significantly outpacing all other regions and suggesting concentrated security instability—likely linked to historical ethnic, resource, or border sensitivities. Guangdong (13.7) and Beijing (11.3) follow as secondary hotspots; Guangdong's exposure reflects its role as China's economic and international-interface hub, while Beijing's risk reflects political centrality and diplomatic friction. Coastal provinces (Hainan, Shanghai, Liaoning) and Hubei show moderate but persistent risk, consistent with international trade interdependencies and cross-border pressure points. Inland regions (Tibet, Guizhou, Heilongjiang) remain elevated relative to national average, indicating distributed rather than singular vulnerability.
How GeoBit Would Assist
Security teams should deploy AOI Monitoring & Early Warning on Gansu, Guangdong, and Beijing to detect emerging incidents in real time with automated alerting. Intel Sweep (global event feeds, X/Twitter & Telegram OSINT, multi-language fusion) would corroborate individual incident reports and track actor networks tied to the 2026-06-22–23 events. Network & Actor Analysis would map relationships between protest organizers, diplomatic actors, and business entities under sanction, enabling rapid duty-of-care assessment for staff and asset exposure.
7-Day Outlook
Escalation trajectory remains uncertain but elevated: the China–Australia kinetic incident, combined with synchronized sanctions and diplomatic disapproval, suggests sustained external pressure without immediate de-escalation signals. Internal dissent indicators (staff rallies, school statements) may amplify as sanctions impact circulate. Gansu and coastal regions warrant heightened monitoring; corporate and educational entities should expect continued reputational/regulatory scrutiny and potential movement restrictions on personnel.
Highest-Risk Areas — Ranked
| # | State / Region | Risk |
|---|---|---|
| 1 | Gansu | 33.1 |
| 2 | Guangdong Province | 13.7 |
| 3 | Beijing | 11.7 |
| 4 | Hainan Province | 8.7 |
| 5 | Shanghai | 5.7 |
| 6 | Liaoning | 5.1 |
| 7 | Heilongjiang | 4.8 |
| 8 | Guizhou | 4.6 |
| 9 | Hubei | 4.4 |
| 10 | Tianjin | 4.4 |
| 11 | Tibet | 3.9 |
| 12 | Zhejiang | 3.9 |
Sources
Previous Daily Briefs
A new China brief is written every day — each with its own risk map and downloadable CSV. Here's the last week; use the calendar to go further back.
📅 Browse every day by calendar →
Highlighted days have a brief. Tap a day for that day's map & analysis, or “csv” for that day's dataset ($5).