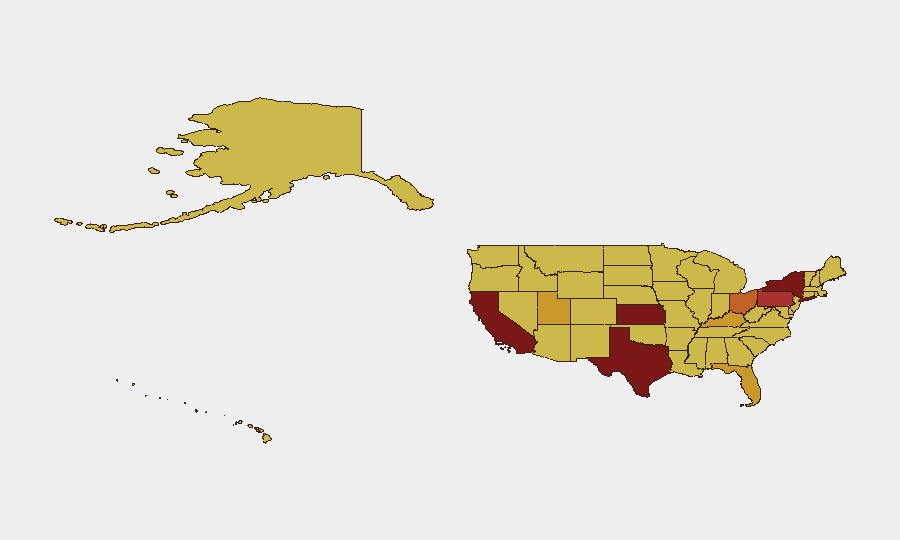
Situation Summary
The United States ranks #12 globally on GeoBit's threat composite (92/100), with 5,129 tracked security events. The risk landscape is regionally concentrated, with California, Texas, and New York driving elevated threat scores. Recent signal activity indicates scattered public statements, administrative tensions, and localized protest or civil-order friction across multiple states. The overall trajectory suggests fragmented, sub-national stress points rather than systemic national crisis, though volatility remains elevated.
Key Developments
Note: GeoBit's event-signal data (listed above) includes categorical flags from 27–29 June 2026 but lacks verifiable, time-stamped incident detail and corroborating open-source confirmation from breaking-news outlets. The following signals were flagged by the platform:
- Public statement activity (27–29 June, NYC, national, Utah, authorities-vs-public) — multiple official and civic statements logged; specific content and triggering incidents require live-news corroboration.
- Military/enforcement signal (29 June, Colorado) — "Conventional Military Force" event involving firefighter response; scale and nature unconfirmed without incident-specific reporting.
- Border/territorial alert (28 June, Saskatchewan–Montana border) — "Occupy Territory" classification; context and participants require verification.
- Administrative sanctions (27 June, Washington) — Department of Defense administrative sanction initiated; policy or disciplinary scope unclear from signal alone.
- Judicial activity (27 June, ongoing) — Supreme Court rejection and judge disapproval signals; subject matter not specified.
- Chicago civic friction (27 June) — "Disapprove" signal between authorities and city; resolution status unknown.
- Media-authority tension (29 June, Utah) — Public statement by state authorities directed at media; substance requires reporting corroboration.
All signals require live open-source corroboration (AP, Reuters, local news, state/federal agency releases) to confirm specificity, timeline, and operational impact.
Highest-Risk Areas
California (94.6) leads sub-national risk, driven by scale, asset density, and historically sustained event volume across infrastructure, civil unrest, and cyber domains. Texas (86.2) and New York (81.3) follow, reflecting population, critical infrastructure, and interstate border/port exposure. Kansas (81.0) and Pennsylvania (76.2) show elevated scores likely tied to agricultural, energy, or manufacturing sectors and recent event clustering. Together, these five states account for disproportionate event density and represent the geographic priority for duty-of-care and asset-protection teams.
How GeoBit Would Assist
Security teams would deploy AOI Monitoring & Early Warning to establish persistent watches on highest-risk sub-regions (California ports, Texas border crossings, NYC transit/financial zones) with real-time alerting on civil unrest, infrastructure disruption, or crowd-event escalation. Intel Sweep and X/Twitter & Telegram OSINT would provide continuous open-source event corroboration, actor-network mapping, and sentiment analysis to validate platform signals and forecast localized volatility. Routing & Network Analysis would enable alternative journey and supply-chain planning for personnel and assets transiting high-risk corridors, particularly in California, Texas, and border regions.
7-Day Outlook
Signal frequency and geographic scatter suggest continued sub-national friction rather than coordinated national crisis. Expect persistent administrative, civic, and media-authority tensions, particularly in California and Texas, with episodic public statements and localized protest or enforcement activity. Volatility remains elevated; escalation risk is localized and event-dependent rather than systemic.
Highest-Risk Areas — Ranked
| # | State / Region | Risk |
|---|---|---|
| 1 | California | 94.6 |
| 2 | Texas | 86.2 |
| 3 | New York | 81.3 |
| 4 | Kansas | 81 |
| 5 | Pennsylvania | 76.2 |
| 6 | Ohio | 75.5 |
| 7 | Florida | 72 |
| 8 | Utah | 71.9 |
| 9 | Kentucky | 71.7 |
| 10 | Oklahoma | 69.8 |
| 11 | Virginia | 69.5 |
| 12 | Louisiana | 69.2 |
Sources
Previous Daily Briefs
A new United States brief is written every day — each with its own risk map and downloadable CSV. Here's the last week; use the calendar to go further back.
📅 Browse every day by calendar →
Highlighted days have a brief. Tap a day for that day's map & analysis, or “csv” for that day's dataset ($5).