Situation Summary
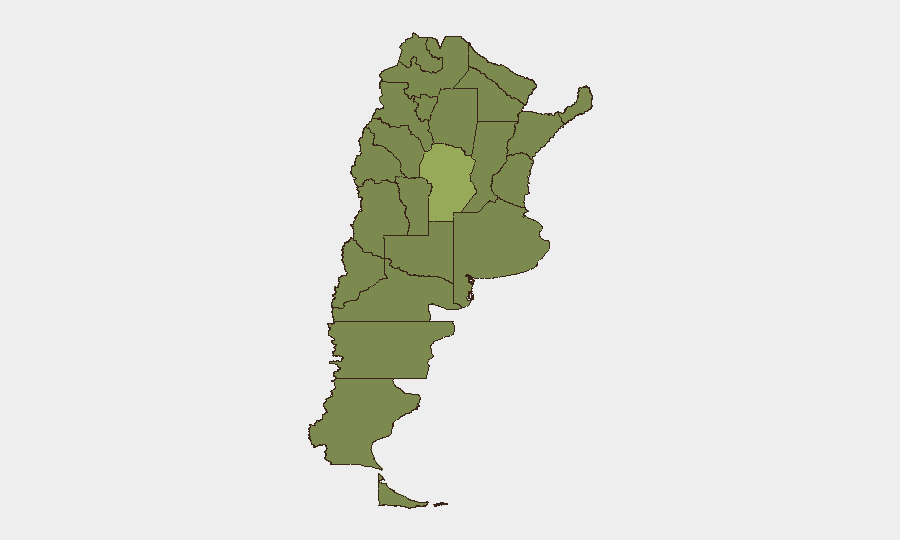
Argentina remains at moderate composite threat (rank 45 globally, score 41), with structural vulnerability concentrated in three northern and central provinces. No major security incidents have been corroborated in the past 24–48 hours; the country's risk profile reflects persistent localized crime, periodic labor unrest, and inter-agency friction rather than acute escalation. Current trajectory appears stable, though political and economic pressures continue to drive periodic public demonstrations and informal sector volatility.
Key Developments
Open-source monitoring and GeoBit's web research identified no reliably documented, location-specific security or unrest incidents in Argentina between 12–14 July 2026. Recent event signals in the platform reflect political and administrative activity (presidential detention action, judicial statements, deputy commentary, labor disputes, police statements, and government investigation) rather than security events. Major Argentina-focused news outlets and social channels currently emphasize economic policy and World Cup coverage; last clearly dated street-level incidents (e.g., stadium-adjacent clashes) fall outside the 24–48 hour window. Wildfire emergency conditions persist in Patagonian provinces (Chubut, Tierra del Fuego) as a longer-term environmental hazard, not a new 24–48 hour development. Labor pickets (piquetes) remain an intermittent risk factor nationwide but no specific blockade or protest has been confirmed for 12–14 July with verifiable date and location.
Highest-Risk Areas
Córdoba Province dominates the sub-national ranking (58.8), driven by organized crime activity, drug-trafficking networks, and gang-related violence in peripheral neighborhoods around the capital city. Buenos Aires Province (35.7) follows, reflecting spillover from organized crime into the metro fringe, residential robbery, and narcotics distribution. Jujuy (33.0) and Santa Fe (31.8) show elevated risk linked to border smuggling, interclan conflicts, and localized trafficking infrastructure. The Autonomous City of Buenos Aires itself (29.3) carries moderate risk concentrated in specific barrios; wealthy and business districts remain relatively secure. Northern provinces (Jujuy, Misiones, Chaco, Santiago del Estero, Corrientes) reflect cross-border vulnerability and informal economy dependency, amplifying both crime and protest risk.
How GeoBit Would Assist
Security teams should deploy GeoBit's Intel Sweep and multi-language OSINT feed to monitor Argentine news, social media (X, Telegram), and local broadcasts for real-time incident confirmation in high-risk provinces, especially Córdoba and Buenos Aires Province. AOI Monitoring & Early Warning capabilities enable persistent watch over known trouble zones (piquete hotspots, stadium precincts, major transport hubs) with automated alerts for emerging activity. Network & Actor Analysis combined with event-feed fusion & corroboration allows teams to track labor union movements, gang activity, and political friction—early signals of escalation—before incidents become operational hazards.
7-Day Outlook
No acute escalation is anticipated in the immediate 7-day window. Monitoring should continue for labor action (particularly if economic policy announcements trigger new piquetes) and for any intensification of gang or trafficking violence in Córdoba and northern provinces. Weather and wildfire conditions in Patagonia may create secondary humanitarian or logistics challenges for operations in those regions.
Highest-Risk Areas — Ranked
| # | State / Region | Risk |
|---|---|---|
| 1 | Córdoba | 58.8 |
| 2 | Buenos Aires Province | 35.7 |
| 3 | Jujuy Province | 33 |
| 4 | Santa Fe Province | 31.8 |
| 5 | Chaco Province | 31.8 |
| 6 | Misiones | 31 |
| 7 | Santiago del Estero Province | 30.3 |
| 8 | Chubut Province | 29.3 |
| 9 | Tierra del Fuego Province | 29.3 |
| 10 | Corrientes Province | 29.3 |
| 11 | Entre Ríos Province | 29.3 |
| 12 | Autonomous City of Buenos Aires | 29.3 |
Sources
Previous Daily Briefs
A new Argentina brief is written every day — each with its own risk map and downloadable CSV. Here's the last week; use the calendar to go further back.
📅 Browse every day by calendar →
Highlighted days have a brief. Tap a day for that day's map & analysis, or “csv” for that day's dataset ($5).
Atlas — our AI intelligence desk — emails them this snapshot personally. Nothing else, no list.