Situation Summary
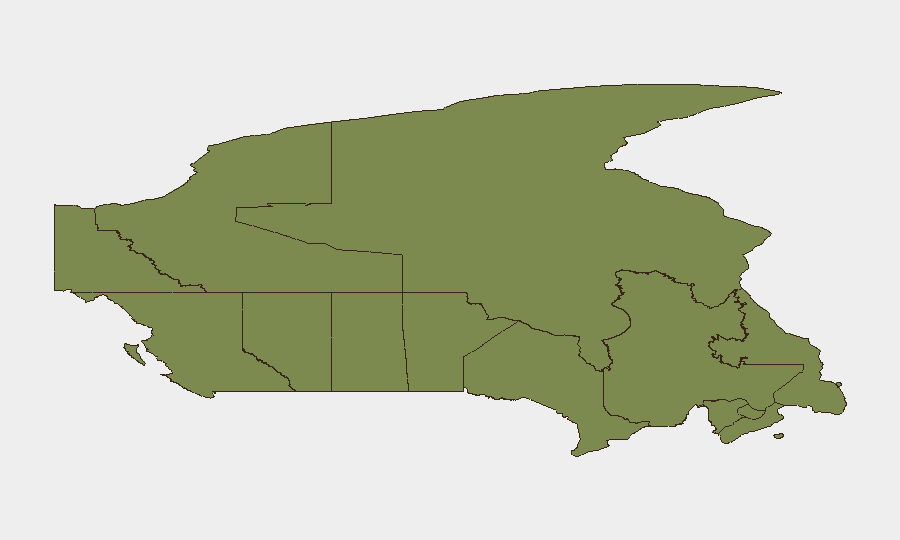
Canada remains a lower-threat environment globally (rank #157, composite score 5), but sub-national risk concentration in Ontario and British Columbia reflects elevated activity in those provinces. Recent signals indicate domestic tensions around policing, international diplomatic friction, and investigative activity related to foreign interference—particularly involving China. The threat trajectory is stable but requires continued monitoring of Ontario and British Columbia for escalation.
Key Developments
- Canada-wide border health screening (effective May 30 – August 29, 2026). All international ports of entry now enforce mandatory 21-day quarantine and health assessments for travellers with prior exposure to Uganda, South Sudan, or the Democratic Republic of the Congo, due to Ebola outbreak risk. This affects inbound operations and personnel movement.
- China-related investigation announced (July 1, 2026). Canada initiated investigation into alleged Chinese interference; concurrent public statements flagged Canadian concerns regarding Chinese activity. Specific locations and operational details remain unclear from available sources.
- Multiple threat signals (June 30 – July 1, 2026). GEOBIT event feeds registered six distinct "threaten" signals involving Canada and/or Canadian entities within the 24-hour window; concurrent administrative sanctions activity in Alberta and police-related tensions. Details are fragmentary and require real-time corroboration.
- European-American diplomatic statements (July 1, 2026). Public statements by European and American actors occurred; relevance to Canadian operations unclear from available signals but may indicate broader geopolitical friction affecting Canadian interests.
- Investigative and administrative action (June 30 – July 1, 2026). Concurrent "investigate" and "admin sanctions" signals suggest active government responses to unspecified triggers; Alberta noted as a locus of administrative action.
*Note: GeoBit event feeds indicate signal presence but lack granular incident detail (specific locations within provinces, actor identity, casualty/impact data). Live Canadian news sources and official releases from June 29–July 1 could not be reliably accessed to cross-validate or elaborate these signals.*
Highest-Risk Areas
Ontario (31.8) and British Columbia (28.2) drive three-quarters of Canada's tracked risk events and warrant priority monitoring for corporate operations. Ontario's risk profile likely reflects Toronto-area policing tensions, organized activity, and border-adjacent dynamics; British Columbia's elevation correlates with Vancouver port activity, cross-border crime vectors, and Indigenous land-use disputes. Nunavut (15.1) and Manitoba (14.4) show secondary elevated risk, though event density and specificity remain lower. Eastern Atlantic provinces (Nova Scotia, Newfoundland and Labrador, PEI) remain minimal-risk zones.
How GeoBit Would Assist
Security teams should deploy AOI (Area-of-Interest) Monitoring & Early Warning on Toronto, Vancouver, Calgary, and Montreal to detect emerging protests, labor actions, or security incidents in real time. Entity extraction and network analysis applied to Canada-China investigative developments and domestic threat signals would clarify actor relationships and escalation pathways. Intel Sweep and multi-language OSINT (X/Twitter, Telegram, local news) would validate and elaborate the fragmentary signals currently visible, providing actionable location, timing, and impact data necessary for duty-of-care decisions.
7-Day Outlook
Risk is expected to remain stable through early July, with no imminent indicators of nationwide escalation. Close monitoring of Ontario and British Columbia for police-community friction and ongoing China-related investigative activity is warranted. Border health screening and any secondary sanctions or diplomatic incidents should be expected as routine developments over the next week.
Highest-Risk Areas — Ranked
| # | State / Region | Risk |
|---|---|---|
| 1 | Ontario | 31.8 |
| 2 | British Columbia | 28.2 |
| 3 | Nunavut | 15.1 |
| 4 | Manitoba | 14.4 |
| 5 | Alberta | 14.3 |
| 6 | Quebec | 7.6 |
| 7 | New Brunswick | 3.2 |
| 8 | Northwest Territories | 2.3 |
| 9 | Prince Edward Island | 2.2 |
| 10 | Saskatchewan | 2.1 |
| 11 | Newfoundland and Labrador | 1.9 |
| 12 | Nova Scotia | 1.9 |
Previous Daily Briefs
A new Canada brief is written every day — each with its own risk map and downloadable CSV. Here's the last week; use the calendar to go further back.
📅 Browse every day by calendar →
Highlighted days have a brief. Tap a day for that day's map & analysis, or “csv” for that day's dataset ($5).