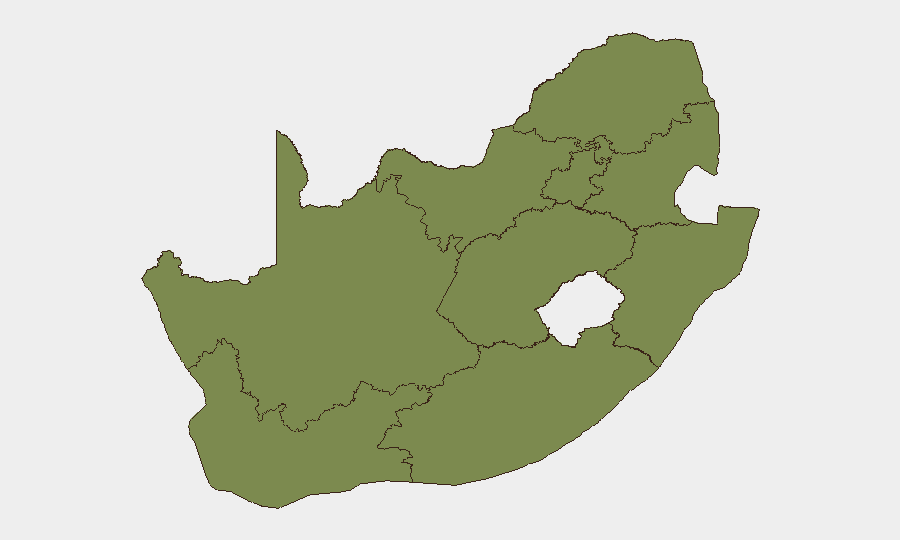
Situation Summary
South Africa's security environment remains fragmented, with Gauteng province driving the majority of national risk (composite score 33.4, more than double the second-ranked region). The past 72 hours have seen heightened enforcement activity, escalating anti-foreign business protests in township and rural areas, and an unusual attempted bombing incident. While the country ranks #91 globally, internal disparities are acute: Gauteng's threat level substantially exceeds the national average, while five provinces remain below score 6.0.
Key Developments
- Ballito, KwaZulu-Natal (26 July): A teenager was arrested after attempting to detonate a homemade explosive device inside Ballito Junction Mall. The device failed to ignite, but the incident represents an uncommon act of attempted violence at a commercial venue and has prompted heightened police investigation and mall-security reviews.
- Gauteng – Operation Shanela intensification (24–26 July): Police conducted focused enforcement in Johannesburg and Pretoria, arresting over 1,200 people including 159 undocumented foreign nationals and 751 wanted suspects linked to serious crime. Authorities attribute the surge to recent anti-immigration violence and looting.
- Mpumalanga – anti-foreign shop closures (week of 20–26 July): Communities in Emalahleni and surrounding areas escalated forced shutdowns of foreign-owned businesses, citing lack of documentation. These actions reflect deepening economic and immigration tensions and carry localized civil-unrest risk.
- Soweto, Gauteng – foreign-trader tensions (late July): Residents in Dobsonville have protested foreign-owned spaza shops; at least one local property owner publicly intervened to protect foreign tenants. The incident underscores friction around foreign businesses in townships and potential for property damage or intimidation.
- Johannesburg, Gauteng – water-levy litigation (25–26 July): AfriForum filed an urgent High Court application to overturn a 65.6% water levy increase imposed by the city. While non-violent, the dispute signals service-delivery and municipal-governance tensions that can trigger broader protests if implemented.
- Nationwide Operation Shanela II (13–19 July, reported 24–26 July): A week-long security sweep detained 17,583 suspects, including 1,777 wanted for serious violent crime, 320 for drug trafficking, and 3,622 irregular migrants. Reporting in the past two days underscores sustained nationwide enforcement and increased checkpoint/police presence.
Highest-Risk Areas
Gauteng dominates the risk profile and accounts for the plurality of tracked security events. Its score of 33.4 reflects the concentration of economic activity, population density, and organized crime in Johannesburg and Pretoria, compounded by recent anti-foreign protests and intensified police operations. Eastern Cape and Western Cape follow at 13.8 and 13.1 respectively, driven by service-delivery tensions and localized organized crime. KwaZulu-Natal's score of 6.2 masks the Ballito bombing attempt and ongoing township vulnerabilities. The remaining five provinces remain lower-risk but warrant monitoring for secondary unrest linked to immigration and economic stress.
How GeoBit Would Assist
Security teams should leverage AOI Monitoring & Early Warning to track Gauteng hotspots (Johannesburg CBD, Soweto, Pretoria) for protest activity and checkpoint intensity. Intel Sweep and OSINT fusion (X/Twitter, Telegram, YouTube) would corroborate township sentiment around foreign traders and flag emerging flashpoints in Mpumalanga and KwaZulu-Natal. Routing & Network Analysis would enable real-time alternative-route planning to avoid Operation Shanela checkpoints and anti-foreign protest zones, and GIS & Spatial Analysis would map sub-provincial risk clusters to inform duty-of-care decisions for personnel or asset locations.
7-Day Outlook
Enforcement intensity under Operation Shanela is likely to sustain through the immediate period, increasing checkpoint delays and arrest risk for undocumented individuals. Anti-foreign sentiment in townships and rural areas is expected to persist, particularly around spaza shops and informal trading; localized confrontations are possible but widespread organized violence is not imminent. Gauteng will remain the primary locus of risk, with secondary concern for Mpumalanga and Eastern Cape should economic or migration pressures escalate.
Highest-Risk Areas — Ranked
| # | State / Region | Risk |
|---|---|---|
| 1 | Gauteng | 33.4 |
| 2 | Eastern Cape | 13.8 |
| 3 | Western Cape | 13.1 |
| 4 | Limpopo | 8.9 |
| 5 | KwaZulu-Natal | 6.2 |
| 6 | North West | 5.5 |
| 7 | Northern Cape | 4.4 |
| 8 | Free State | 3.4 |
| 9 | Mpumalanga | 3.4 |
Previous Daily Briefs
A new South Africa brief is written every day — each with its own risk map and downloadable CSV. Here's the last week; use the calendar to go further back.
📅 Browse every day by calendar →
Highlighted days have a brief. Tap a day for that day's map & analysis, or “csv” for that day's dataset ($5).
Atlas — our AI intelligence desk — emails them this snapshot personally. Nothing else, no list.