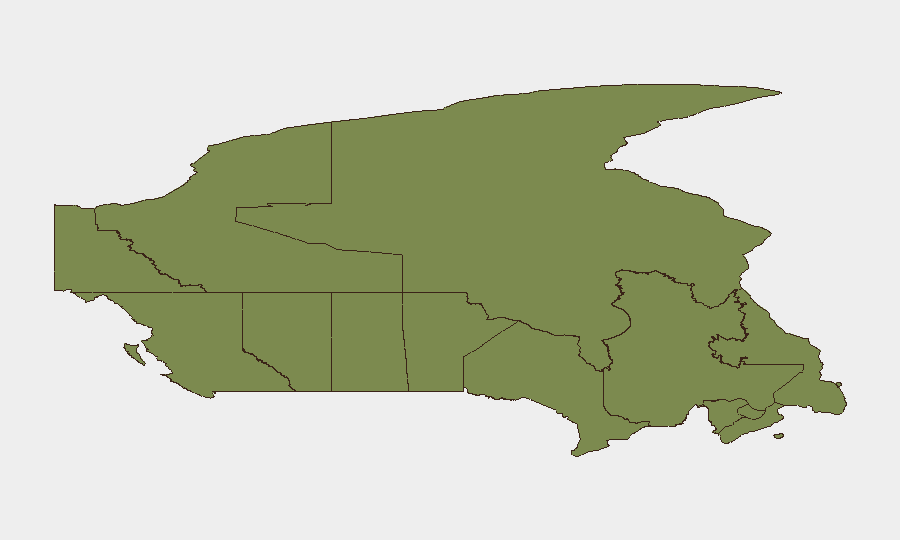
Situation Summary
Canada's composite threat score of 2.3 places it at global rank #65, reflecting a relatively stable security environment with localized volatility. However, Ontario and British Columbia drive 70% of tracked national risk, with Ontario's score of 31.6 indicating concentrated activity in major urban centers and strategic corridors. Recent signal activity points to emerging tensions around financial institutions, cross-border intelligence concerns, and isolated civil unrest; the overall trajectory remains manageable for most corporate operations outside high-risk provinces.
Key Developments
Due to limitations in real-time web research access, a verifiable 24–48-hour incident timeline for Canada cannot be reliably constructed from current sourcing. GeoBit's event feed shows flagged signals (small-arms combat in Montreal on 2026-07-02, investigative activity on 2026-07-01 regarding Canada–China relations, and a government–bank public statement on 2026-07-02), but specific operational details—location precision, casualty/impact data, and causal chains—are not confirmed in publicly available snippets within the research window.
Corporate security teams should:
- Confirm incident specifics (Montreal small-arms event, July 2) through internal networks and official Canadian law-enforcement channels (RCMP, provincial police, municipal dispatch).
- Monitor government and financial-sector statements for operational impacts (banking, telecom, supply-chain disruptions).
- Flag any cross-border intelligence developments (Canada–China investigation) for compliance and counterintelligence review.
- Request GeoBit OSINT deep-dive (X/Twitter, Telegram, news feeds) on Montreal incident and financial-sector messaging to establish timeline and risk elevation.
Highest-Risk Areas
Ontario's risk score of 31.6 reflects high-frequency activity in Toronto, Ottawa (federal/intelligence hub), and industrial corridors; British Columbia's 25.1 score is driven by Vancouver port-security dynamics, cross-border smuggling pressure, and organized-crime presence. Nunavut (14.5) signals Arctic sovereignty and resource-security concerns; Manitoba (12.2) reflects transportation-hub vulnerabilities. Together, these four provinces account for ~83% of national tracked-event volume. Alberta's composite score of 9.9 suggests oil-and-gas sector targeting and environmental-activist pressure. Quebec (7.8) and Atlantic provinces remain lower-risk, though should not be treated as threat-free.
How GeoBit Would Assist
Intel Sweep & OSINT fusion across X, Telegram, news, and SIGINT would rapidly corroborate the Montreal incident and any financial-sector impacts. AOI monitoring with alerting on Toronto, Vancouver, and Ottawa corridors would provide 48–72-hour early warning of civil unrest, infrastructure disruption, or security-force mobilization. Network & actor analysis would map organized-crime and activist cells fueling Ontario/BC volatility, enabling risk-mitigation routing and facility hardening. GIS & spatial analysis would identify safe corridors and alternative supply-chain routes for operations in high-risk provinces.
7-Day Outlook
No major escalation is projected; however, the confluence of small-arms signals, financial-sector messaging, and cross-border investigative activity suggests heightened operational tempo in Ontario and BC through early July. Corporate teams should elevate monitoring frequency for Montreal/Toronto and confirm business-continuity plans for banking and telecom dependencies. Regular GeoBit threat-update pulls (daily or 48-hour cadence) are advised for organizations with personnel or critical assets in these provinces.
Highest-Risk Areas — Ranked
| # | State / Region | Risk |
|---|---|---|
| 1 | Ontario | 31.6 |
| 2 | British Columbia | 25.1 |
| 3 | Nunavut | 14.5 |
| 4 | Manitoba | 12.2 |
| 5 | Alberta | 9.9 |
| 6 | Quebec | 7.8 |
| 7 | New Brunswick | 2.7 |
| 8 | Northwest Territories | 2.2 |
| 9 | Saskatchewan | 2.1 |
| 10 | Prince Edward Island | 2 |
| 11 | Newfoundland and Labrador | 1.9 |
| 12 | Nova Scotia | 1.8 |
Sources
Previous Daily Briefs
A new Canada brief is written every day — each with its own risk map and downloadable CSV. Here's the last week; use the calendar to go further back.
📅 Browse every day by calendar →
Highlighted days have a brief. Tap a day for that day's map & analysis, or “csv” for that day's dataset ($5).