Situation Summary
Cuba remains at global threat rank #98 with a composite score of 10 across 288 tracked events. The country is experiencing elevated social unrest, security-force activity, and economic pressure, with Sancti Spiritus and Havana identified as substantially higher-risk zones. Current trajectory reflects ongoing protest activity and government response, compounded by infrastructure strain and international scrutiny.
Key Developments
Limitation on Current Events (24–48 Hours)
GeoBit's research confirms that while the event signal feed flags multiple recent activity types (arrests/detentions, demonstrations, blockade activity, and public statements), open web sources do not provide clearly time-stamped incidents that can be confidently placed within the last 24–48 hours (i.e., July 17–18, 2026).
Most verifiable recent reporting concerns:
- Protest wave and detentions — Havana and nationwide (peaked earlier in July 2026). Civil-society tallies document at least 14 individuals detained and 18 arbitrary detentions linked to cacerolazo demonstrations and protests, with 207 associated abuses reported. These incidents are tied to protest activity that peaked *earlier in the week* of July 13–17; no new detention episodes are confirmed in the last 48 hours.
- Power infrastructure disruption — Cuba nationwide (week of July 13–17, 2026). Multiple outlets reported the third nationwide blackout in two weeks, with full grid collapse reported. Articles are dated to *earlier in the week*, not within the last 24–48 hours; social-media references to blackouts likely cite this prior incident.
- Strategic-level U.S.–Iran–Cuba concern (July 14, 2026 — outside 48-hour window). President Trump publicly stated on July 14 that the U.S. is investigating alleged Iranian drone and missile storage in Cuba and warned of potential U.S. action if confirmed. This is significant for duty-of-care planning but predates the 24–48-hour window.
- Economic measure — cooking gas price increase (date not confirmed within 24–48 hours). Reporting indicates official price rise from 2.50 to 4.97 pesos per cubic meter. Publication date is not explicitly pinned to July 17–18.
Highest-Risk Areas
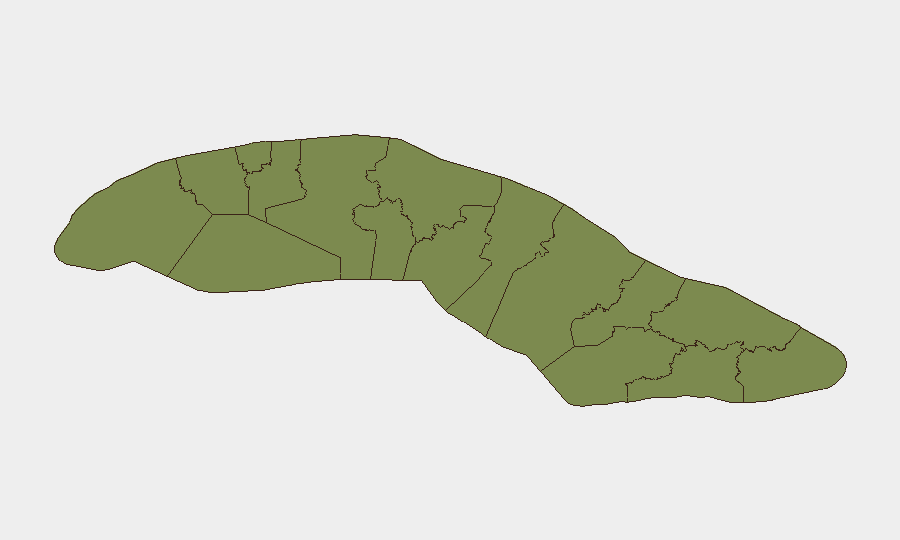
Sancti Spiritus dominates the sub-national risk profile (34.8) and warrants concentrated monitoring; Havana (25.6) ranks second and remains the primary locus of protest activity, detentions, and government security operations. These two provinces account for the majority of tracked threat events. Matanzas (8.4) and Artemisa (6.6) show secondary elevation, likely driven by spillover from Havana-centered unrest and economic hardship. The concentration of risk in Sancti Spiritus specifically should trigger inquiry into localized infrastructure, criminal, or protest drivers not yet fully visible in open reporting.
How GeoBit Would Assist
Security teams with personnel or assets in Cuba should employ AOI Monitoring & Early Warning (persistent watch on Sancti Spiritus, Havana, and Matanzas with real-time alerting on protest, security, and infrastructure disruption), Intel Sweep and X/Twitter/Telegram OSINT (to capture protest announcements and detentions with precise timestamps), and Conflict & Military / Network & Actor Analysis (to track security-force deployment and dissident networks). Regime-stability search and Economic & Trade monitoring will help flag cascading effects of power outages and price increases on broader social stability.
7-Day Outlook
Absent major new shocks, protest activity and government detention responses are likely to continue at observed levels through mid-to-late July. Infrastructure fragility and economic pressure (fuel, food, electricity) will remain persistent drivers of unrest. International attention to the alleged Iranian military presence in Cuba adds a strategic-risk layer that could trigger rapid policy or military posturing.
Highest-Risk Areas — Ranked
| # | State / Region | Risk |
|---|---|---|
| 1 | Sancti Spiritus | 34.8 |
| 2 | Havana | 25.6 |
| 3 | Matanzas | 8.4 |
| 4 | Artemisa | 6.6 |
| 5 | Isle of Youth | 6.1 |
| 6 | Las Tunas | 5.8 |
| 7 | Santiago de Cuba | 5.8 |
| 8 | Mayabeque | 5.1 |
| 9 | Pinar del Rio | 4.8 |
| 10 | Cienfuegos | 4.8 |
| 11 | Villa Clara | 4.8 |
| 12 | Ciego de Avila | 4.8 |
Sources
Previous Daily Briefs
A new Cuba brief is written every day — each with its own risk map and downloadable CSV. Here's the last week; use the calendar to go further back.
📅 Browse every day by calendar →
Highlighted days have a brief. Tap a day for that day's map & analysis, or “csv” for that day's dataset ($5).
Atlas — our AI intelligence desk — emails them this snapshot personally. Nothing else, no list.