Situation Summary
Egypt remains elevated on the global threat matrix (rank #14, composite score 94) amid a cluster of security incidents spanning terrorist activity, military operations, civil unrest, and institutional friction over the past 72 hours. A significant rail disaster in Matrouh on 2026-07-18 has compounded operational strain. The concurrent signals of unconventional violence, military posturing, journalist detention, and naval activity suggest fragmented but overlapping pressure points across governance, security services, and civil space rather than a single unified crisis.
Key Developments
- Matrouh Governorate, 2026-07-18: Train derailment killed 3 and injured 94 according to Egypt's Health Ministry. Incident underscores infrastructure vulnerability and emergency-response load in a governorate already ranked among the top 12 highest-risk zones.
- Cairo/National, 2026-07-18–19: Terrorist attack signal recorded 2026-07-18; followed by military/police power demonstration 2026-07-19, suggesting security forces response or escalation posture.
- Journalist Detention, 2026-07-17–18: Unconventional violence incident involving journalist vs. commander (2026-07-17), followed by administrative sanctions against journalist (2026-07-18). Signals compression of civil-media space.
- Government Demands, 2026-07-19: Two separate demand signals issued by government on 2026-07-19—one domestic, one directed at Argentina—alongside arrest/detention activity at police and prison level. Indicates institutional pressure and possible enforcement acceleration.
- Naval/Military Activity, 2026-07-19: Conventional military force incident recorded at village level concurrent with arrest/detention and government demands, pattern consistent with enforcement or territorial assertion.
- Maritime Incident (Background Context): Egypt condemned Somaliland's opening of an embassy in occupied Jerusalem and called on Somalia to secure release of kidnapped Egyptian sailors (2026-07-19), reflecting ongoing maritime security exposure in Red Sea and broader Horn of Africa friction.
Highest-Risk Areas
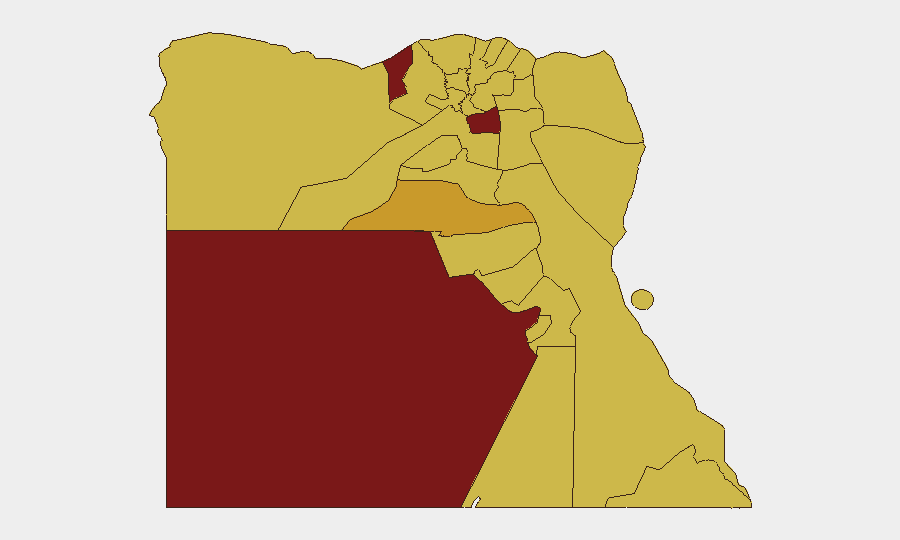
Alexandria (95.7) and New Valley (87.8) lead the sub-national risk ranking, followed by Cairo (83.2) and Al Minya (71.7). The concentration of risk in major urban centers and peripheral energy/resource zones reflects both density of security events and structural vulnerabilities—port activity and tourism in Alexandria, government capacity in Cairo, militant presence in Upper Egypt (Al Minya, Qena). The clustering of North Sinai, South Sinai, and Red Sea governorates in the 65–66 range signals persistent counterinsurgency operations and border instability; Halaib Triangle's elevated score reflects disputed-territory dynamics. Regional risk is not uniform: the capital and major cities drive headline events; peripheral zones sustain chronic militant and border pressure.
How GeoBit Would Assist
Corporate security teams should deploy AOI Monitoring & Early Warning on Alexandria, Cairo, and Al Minya to catch incident clusters in real time and alert on changes in tempo or geography. OSINT fusion and multi-language search across Telegram, X, and Egyptian media will isolate emerging narratives around journalist detention, military signaling, and governance friction before they cascade. Conflict & Military tracking combined with Maritime & Aviation tracking will provide continuous visibility on naval operations, Sinai counterinsurgency posture, and Red Sea corridor status—critical for supply-chain and personnel routing decisions.
7-Day Outlook
Security indicators remain volatile across institutional, militant, and civil domains. The Matrouh incident and concurrent arrest/detention signals suggest authorities are executing enforcement actions; terrorist activity 2026-07-18 indicates militant pressure persists. Without new data, expect sustained operational tempo in Cairo and peripheral zones; watch for escalation in journalist/civil-space friction or coordinated militant activity in North/South Sinai. Risk is unlikely to spike dramatically unless terror attacks cluster or military operations widen, but baseline elevated conditions should inform all Egypt travel, asset, and supply-chain decisions.
Highest-Risk Areas — Ranked
| # | State / Region | Risk |
|---|---|---|
| 1 | Alexandria | 95.7 |
| 2 | New Valley | 87.8 |
| 3 | Cairo | 83.2 |
| 4 | Al Minya | 71.7 |
| 5 | Giza | 66.4 |
| 6 | Red Sea | 66 |
| 7 | North Sinai | 65.7 |
| 8 | Qena | 65.7 |
| 9 | South Sinai | 65.7 |
| 10 | Halaib Triangle | 65.7 |
| 11 | Matruh | 65.7 |
| 12 | Kafr El Sheikh | 65.7 |
Sources
Previous Daily Briefs
A new Egypt brief is written every day — each with its own risk map and downloadable CSV. Here's the last week; use the calendar to go further back.
📅 Browse every day by calendar →
Highlighted days have a brief. Tap a day for that day's map & analysis, or “csv” for that day's dataset ($5).
Atlas — our AI intelligence desk — emails them this snapshot personally. Nothing else, no list.