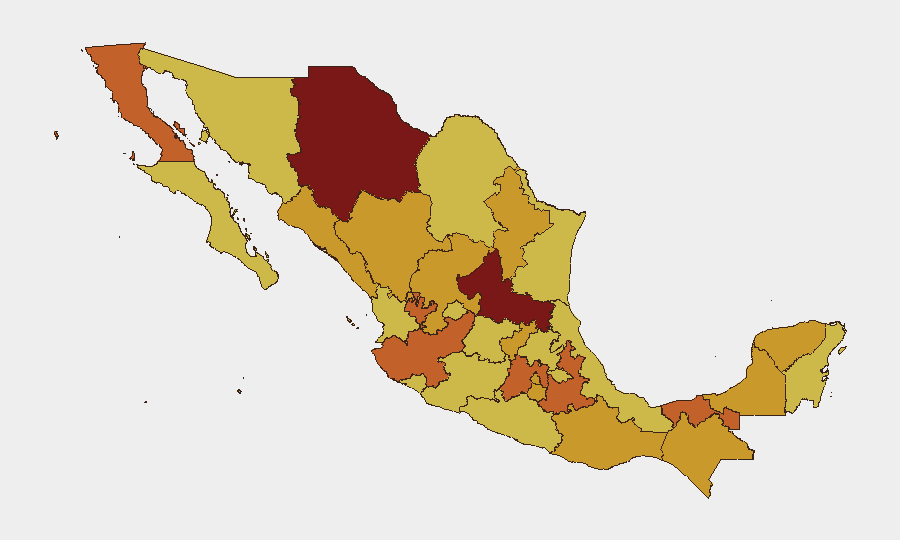
Situation Summary
Mexico remains the seventh-highest-threat country globally, with 1,191 tracked events and a composite threat score of 100. Signal activity over the past 48 hours includes armed engagements involving law enforcement and deputies, military force deployment, legislative action, and cross-border public statements, indicating sustained operational tempo across multiple threat vectors. The security environment is characterized by persistent cartel violence, state capacity constraints in high-risk northern and central regions, and elevated tensions around labor and resource disputes.
Key Developments
- 2026-07-01 · Small arms combat involving COUNSEL and DEPUTIES — Location and casualty data not yet clarified in available sources; suggests armed confrontation in a law-enforcement or judicial context.
- 2026-07-01 · Conventional military force deployment by MEXICO — Indicates active military operations; specific location and tactical scope require clarification via real-time intelligence feeds.
- 2026-07-01 · Legislative demand: LEGISLATURE vs VERACRUZ — State-level dispute signaling governance friction; background and resource conflict unclear from signal metadata alone.
- 2026-07-01 · Cross-border public statement: MEXICO vs CANADA — Bilateral diplomatic or trade friction; context requires urgent clarification given tariff and trade tensions ongoing since June 29.
- 2026-06-29 · Conventional military force event at VILLAGE level — Rural armed engagement; escalation risk in localized conflict zone not yet mapped to specific state.
- 2026-06-30 · Prison facility disapproval signal — Suggests internal security or detention-facility incident; potential custody/rights or riot risk.
*Note:* Web research did not yield corroborated incidents within the last 24–48 hours beyond these signal detections. Older reference events (Cabo San Lucas vehicle incident, June 24; Mexico City World Cup disturbances, June 30) fall outside the current reporting window and are retained for context only.
Highest-Risk Areas
San Luis Potosí (risk 100) and Chihuahua (risk 84.9) represent the acute threat concentration, followed by State of Mexico and Baja California (both ~75). These northern and central states are driven by cartel territorial control, illicit supply-chain logistics, and armed group competition for control of trafficking corridors and revenue bases. State of Mexico and Mexico City (risk 72.6) additionally face organized-crime spillover from northern operations and labor/resource conflict. Jalisco, Tabasco, and Chiapas round out the top tier, reflecting fragmented cartel presence, extortion networks, and localized criminal governance.
How GeoBit Would Assist
Security teams should deploy AOI Monitoring & Early Warning on high-risk state capitals and corporate facilities in San Luis Potosí, Chihuahua, and State of Mexico to detect armed activity, roadblocks, and security force movements in near-real time. Network & Actor Analysis and Intel Sweep (multi-language, X/Telegram, radio SIGINT) will clarify the identities and intentions behind today's armed engagements and legislative demands. Conflict & Military battle mapping and Routing & Network Analysis enable duty-of-care teams to plan safe personnel movement and supply logistics around active combat zones and checkpoints.
7-Day Outlook
Signal intensity (armed engagement, military deployment, cross-border friction) suggests operational escalation or enforcement action over the next 48–72 hours. Legislative and diplomatic signals indicate state-level governance stress; resource or labor disputes may trigger secondary armed incidents in rural areas. Corporate and expatriate teams in San Luis Potosí, Chihuahua, and State of Mexico should maintain elevated situational awareness and flexible contingency protocols.
Highest-Risk Areas — Ranked
| # | State / Region | Risk |
|---|---|---|
| 1 | San Luis Potosí | 100 |
| 2 | Chihuahua | 84.9 |
| 3 | State of Mexico | 75.4 |
| 4 | Baja California | 75.2 |
| 5 | Jalisco | 74.9 |
| 6 | Tabasco | 74.3 |
| 7 | Puebla | 73.9 |
| 8 | Chiapas | 72.9 |
| 9 | Mexico City | 72.6 |
| 10 | Campeche | 72.4 |
| 11 | Zacatecas | 72 |
| 12 | Querétaro | 71.6 |
Sources
Previous Daily Briefs
A new Mexico brief is written every day — each with its own risk map and downloadable CSV. Here's the last week; use the calendar to go further back.
📅 Browse every day by calendar →
Highlighted days have a brief. Tap a day for that day's map & analysis, or “csv” for that day's dataset ($5).