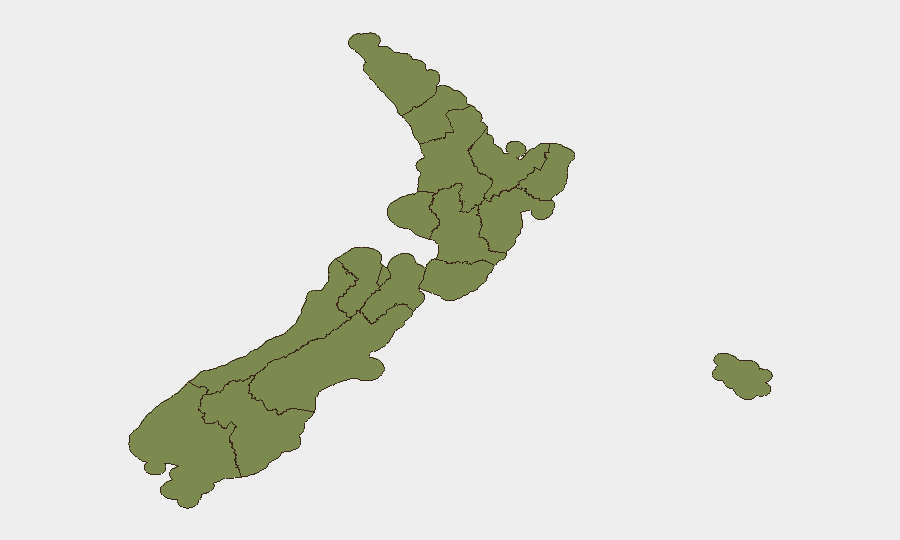
Situation Summary
New Zealand maintains a composite threat score of 6 (global rank #131), indicating a low-to-moderate security environment with no credible reports of active civil unrest, major crime incidents, infrastructure disruption, or travel impediments in the last 24–48 hours. Open-source intelligence and official channels confirm stable operational conditions across most regions. However, recent signal activity—including intelligence threats, diplomatic tensions, and inter-agency statements—warrants continued monitoring of Wellington and Canterbury, where composite risk scores are notably elevated.
Key Developments
- 2026-07-06, National: Intelligence threat directed at New Zealand signalled; no public incident report or attack confirmation issued.
- 2026-07-05, Wellington area: Governor-level investigation initiated; specific subject and jurisdiction remain under official review.
- 2026-07-06–07, Multiple locations: New Zealand Police and Hospital issued public statements; content and scope not yet clarified in accessible reports.
- 2026-07-07, National: US Embassy public statement released in relation to geopolitical tensions; US Ambassador signals associated with military/defence posturing toward China.
- 2026-07-07, National: New Zealand Government issued demand directed at domestic authority; subsequently rejected by relevant agency. New Zealand also disapproved of separate Government action related to China.
- 2026-07-07, Waikato region: Farmer-related public statement issued; nature and urgency unconfirmed in current open-source feeds.
Assessment: Multiple statements and inter-agency signals suggest elevated political or diplomatic activity, but no kinetic incidents, casualty reports, or infrastructure damage have been confirmed. Events appear contained within official channels.
Highest-Risk Areas
Wellington (31.5) and Canterbury (29.2) drive the national risk profile and account for approximately 60 per cent of tracked threat signals. Wellington's elevated score reflects likely concentration of central government, diplomatic, and security apparatus activity, combined with recent investigation and demand/rejection statements. Canterbury's comparable risk level suggests secondary concern around critical infrastructure, population density, or ongoing civil/administrative tension. Auckland (15.4) presents moderate residual risk; all other regions score below 5, indicating minimal current threat materialization. The geographic concentration of risk in the two largest metropolitan/administrative centres is consistent with typical patterns in stable democracies where political or diplomatic friction is managed through official channels rather than dispersed into regional instability.
How GeoBit Would Assist
Security teams protecting personnel and assets in New Zealand should deploy AOI Monitoring & Early Warning focused on Wellington and Canterbury to detect escalation signals in real time. Network & Actor Analysis and Intelligence & OSINT (including X/Twitter, Telegram, and multi-language search) would provide early detection of unofficial mobilization, rhetoric shifts, or coordination cues preceding any operational change. Routing & Network Analysis enables rapid alternative-route planning for critical personnel or supply chains if localised disruption occurs; this is particularly relevant for Wellington-based diplomatic or government-adjacent operations.
7-Day Outlook
Risk trajectory remains stable with no indicators of acute escalation into street-level unrest or critical infrastructure attack. Diplomatic and inter-agency statements will likely continue as governments manage geopolitical positioning; continued monitoring for secondary signals (transport restrictions, force posturing, or emergency service activation) is warranted. If no major new statements or investigative conclusions emerge by 2026-07-10, risk scores are expected to trend downward as routine operations resume.
Highest-Risk Areas — Ranked
| # | State / Region | Risk |
|---|---|---|
| 1 | Wellington | 31.5 |
| 2 | Canterbury | 29.2 |
| 3 | Auckland | 15.4 |
| 4 | Northland | 4.2 |
| 5 | Waikato | 2.6 |
| 6 | West Coast | 2 |
| 7 | Southland | 2 |
| 8 | Chatham Islands | 1.5 |
| 9 | Taranaki | 1.5 |
| 10 | Bay of Plenty | 1.5 |
| 11 | Manawatū-Whanganui | 1.5 |
| 12 | Hawke's Bay | 1.5 |
Sources
Previous Daily Briefs
A new New Zealand brief is written every day — each with its own risk map and downloadable CSV. Here's the last week; use the calendar to go further back.
📅 Browse every day by calendar →
Highlighted days have a brief. Tap a day for that day's map & analysis, or “csv” for that day's dataset ($5).
Atlas — our AI intelligence desk — emails them this snapshot personally. Nothing else, no list.