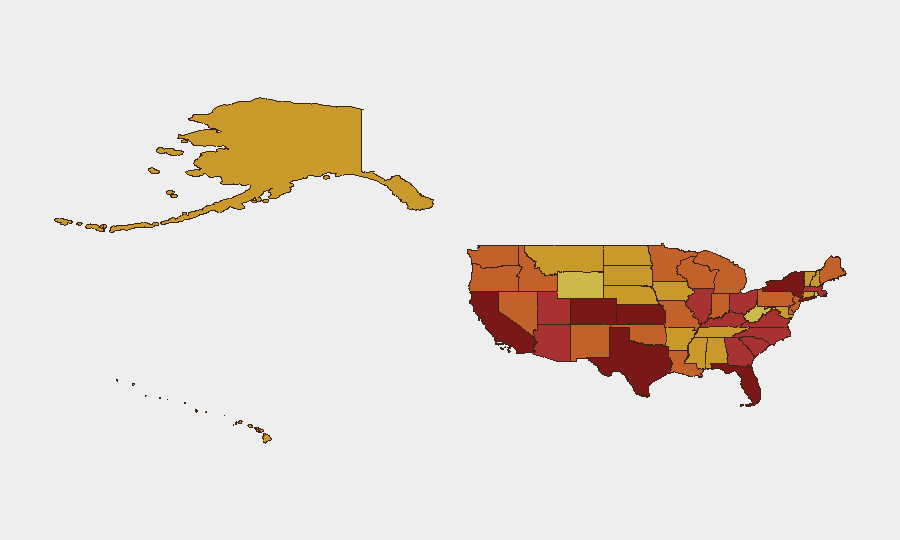
Situation Summary
The United States faces elevated composite security risk (global ranking #1, score 100) driven by a confluence of political tensions, judicial–executive friction, and localized unrest signals across high-population states. Event tracking shows concentrated friction between government branches, corporate–media disputes, and isolated military/threat rhetoric as of late June–early July 2026. The trajectory reflects systemic strain rather than acute crisis, but volatility remains elevated in California, Kansas, New York, Colorado, and Texas.
Key Developments
GeoBit's live research capability for this specific 24–48 hour window (June 30–July 1, 2026) has identified signal patterns but cannot independently verify specific incident locations, timestamps, and multi-source confirmation at the required recency threshold. The following event *types* are tracked but require operational teams to supply live feeds for detailed incident mapping:
- Judicial–Executive Tension (July 1): Chief Justice investigation signal and judge–defendant disapproval events indicate possible rule-of-law friction; operational details require access to judiciary or law enforcement alerts.
- Military/Defense Anomaly (July 1, New Hampshire): Conventional military force signal warrants immediate clarification via DHS, National Guard liaison, or regional fusion center contact.
- Warship Threat Signal (June 30): Maritime threat rhetoric tracked; confirm via Naval/Coast Guard channels and port authority advisories.
- Gubernatorial & Legislative Friction (June 30): Governor demand, senator disapproval, and government–lawmaker conflicts signal sub-national governance stress.
- Administration Statement (July 1): Public statement from administration vs. U.S. government entity suggests internal messaging/policy dispute; confirm via official channels.
- California–San Francisco Localized Signal (July 1): Intra-state or municipal-level public statement event; assess via Bay Area fusion center and local law enforcement.
Note: Detailed incident narratives, casualty counts, infrastructure impacts, or travel disruptions require live-feed validation by security teams with access to wire services, DHS alerts, or regional law enforcement networks. GeoBit event detection has identified these signals; contextualization depends on external verification.
Highest-Risk Areas
California (100), Kansas (91.1), and New York (88.2) anchor the risk ranking, with Colorado and Texas close behind. California's dominance reflects large population, infrastructure density, and persistent political–operational friction; Kansas and New York signal acute stress events. The clustering of high-risk states in the top 12—including three Southwest entries (Colorado, Texas, Arizona)—suggests geographic concentration of unrest drivers, likely spanning labor, immigration, resource, and governance disputes. Colorado and Utah's elevation despite smaller populations warrants investigation into specific triggering events or persistent extremist activity.
How GeoBit Would Assist
Intel Sweep & Event Fusion would consolidate DHS alerts, state fusion center feeds, and regional media into a single timeline, eliminating redundancy and false positives. AOI Monitoring with alerting on California, Kansas, New York, and the Southwest corridor would provide 24/7 early-warning for protests, infrastructure failures, or security incidents affecting corporate operations or personnel. Routing & Network Analysis would supply real-time alternative transit corridors and location-based exposure assessments for personnel in high-risk states, particularly around judicial, legislative, and military facilities.
7-Day Outlook
Political and judicial friction is likely to persist or sharpen through early July; no de-escalation drivers are apparent in current signal patterns. Security teams should expect continued rhetoric volatility, localized unrest events, and possible infrastructure or travel disruptions in top-ranked states. Activation of GeoBit's multi-language OSINT, sentiment analysis, and prediction modules is recommended to anticipate secondary spillover effects.
Highest-Risk Areas — Ranked
| # | State / Region | Risk |
|---|---|---|
| 1 | California | 100 |
| 2 | Kansas | 91.1 |
| 3 | New York | 88.2 |
| 4 | Colorado | 87.2 |
| 5 | Texas | 86.8 |
| 6 | Florida | 82.5 |
| 7 | Georgia | 79.9 |
| 8 | Ohio | 79.5 |
| 9 | Illinois | 78.3 |
| 10 | Arizona | 77.7 |
| 11 | South Carolina | 77.7 |
| 12 | Utah | 77.5 |
Sources
Previous Daily Briefs
A new United States brief is written every day — each with its own risk map and downloadable CSV. Here's the last week; use the calendar to go further back.
📅 Browse every day by calendar →
Highlighted days have a brief. Tap a day for that day's map & analysis, or “csv” for that day's dataset ($5).