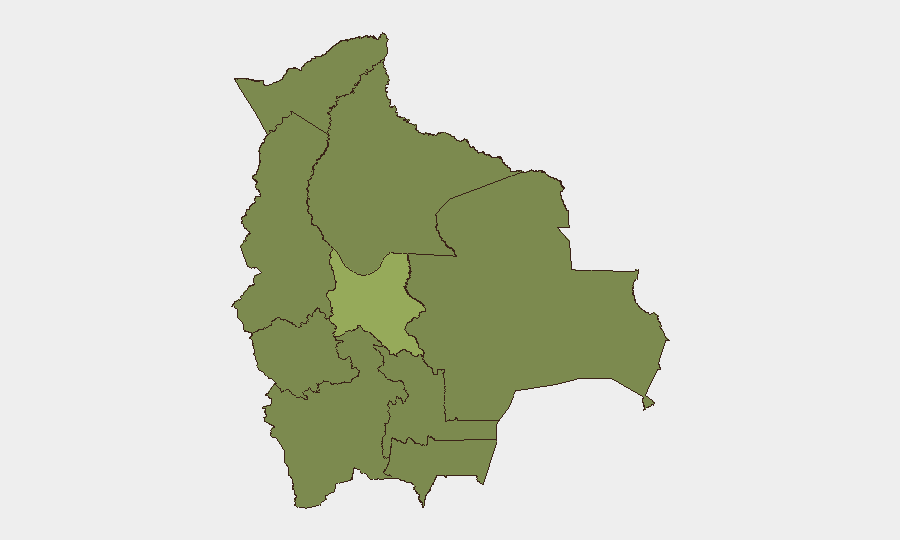
Situation Summary
Bolivia remains at composite threat rank #50 globally with a moderate, stable security profile. No discrete, confirmed security or civil-unrest incidents in Bolivia were verified in the last 24–48 hours from open-source monitoring, major news outlets, or official channels. The threat environment is characterized by persistent structural vulnerabilities—including historical protest cycles, informal-sector crime, and regional coca-economy pressures—rather than acute, date-specific incidents at present.
Key Developments
- No confirmed new incidents in Bolivia (25–27 June 2026). Multi-source open research and social-media monitoring yielded no verifiable security events, protests, roadblocks, attacks, or travel-risk changes in Bolivia specifically during this window. Discussions in Bolivian media referencing past roadblocks and economic disputes reflect historical context, not current escalation.
- Cochabamba remains highest-risk sub-national area with composite risk score 55.1—nearly double the national average. Risk drivers in Cochabamba are linked to coca-sector disputes, informal labor organizing, and historical protest participation, though no acute incident was reported in the last 48 hours.
- Regional context: Eastern and southern departments at baseline risk. La Paz (34.5), Potosí (27.3), Tarija, Pando, Beni, Oruro, Chuquisaca, and Santa Cruz all register at or below 25.1. No new flashpoints were identified in these zones in the reporting window.
- No travel-infrastructure disruptions confirmed. Open-source monitoring found no reports of road closures, blockades, or transport disruptions on major routes (e.g., La Paz–Cochabamba, Santa Cruz–Brazil corridor) as of 27 June 2026.
- International diplomatic or security developments affecting Bolivia: None specific to Bolivia were confirmed in the last 24–48 hours. (Note: Broader regional tensions in other countries were detected, but no direct Bolivian-specific impact is yet documented.)
Highest-Risk Areas
Cochabamba dominates the risk ranking at 55.1, driven by coca-cultivation disputes, informal-sector labor conflicts, and a historical pattern of roadblock-style protests over commodity and wage issues. La Paz (34.5), as the capital and de facto seat of government, concentrates political risk and urban crime; smaller but meaningful elevations in Potosí (27.3) reflect mining-sector tensions. The remaining seven departments cluster at 25.1, indicating stable but persistent baseline risks from informal security actors, loose criminal organization, and smuggling networks rather than organized insurgency or major conflict. No single department is currently in acute escalation.
How GeoBit Would Assist
Teams with personnel or assets in Bolivia should deploy AOI Monitoring & Early Warning on Cochabamba and La Paz to detect protest onset, roadblock formation, or civil unrest before operational impact. Intel Sweep and X/Twitter OSINT (with multi-language support for Spanish) provide real-time signal of labor actions, transport disruptions, and political statements. Routing & Network Analysis enables pre-planned alternative journey routes should primary corridors become impassable; and Risk & Threat Assessment tied to sector-specific intelligence (e.g., coca economy, mining labor) refines duty-of-care protocols for field teams.
7-Day Outlook
No acute escalation is forecast for 27 June–4 July 2026 based on current signals. Baseline risks—localized protest activity, informal crime, and transport disruption—will likely persist in Cochabamba and La Paz; teams should maintain standard security postures and contingency routing. Monitoring should intensify if labor or indigenous organizing signals emerge on social media or official channels.
Highest-Risk Areas — Ranked
| # | State / Region | Risk |
|---|---|---|
| 1 | Cochabamba | 55.1 |
| 2 | La Paz | 34.5 |
| 3 | Potosí | 27.3 |
| 4 | Tarija | 25.1 |
| 5 | Pando | 25.1 |
| 6 | Beni | 25.1 |
| 7 | Oruro | 25.1 |
| 8 | Chuquisaca | 25.1 |
| 9 | Santa Cruz | 25.1 |
Sources
Previous Daily Briefs
A new Bolivia brief is written every day — each with its own risk map and downloadable CSV. Here's the last week; use the calendar to go further back.
📅 Browse every day by calendar →
Highlighted days have a brief. Tap a day for that day's map & analysis, or “csv” for that day's dataset ($5).