Situation Summary
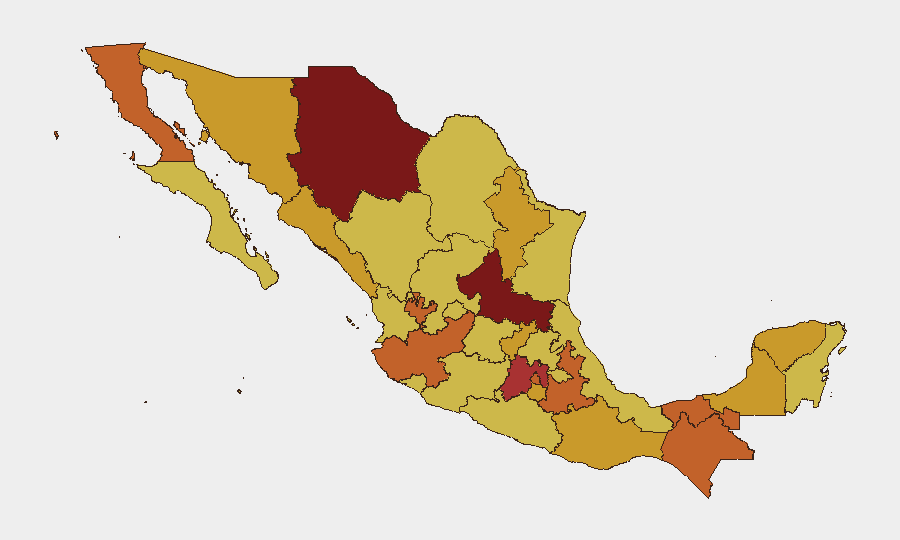
Mexico remains the third-highest global threat environment (composite score 100), driven primarily by gang violence across 1,215 tracked events. Violence is concentrated in northern and central states, particularly San Luis Potosí, Chihuahua, and the State of Mexico, where criminal organizations compete for territorial control and trafficking routes. The security picture shows sustained operational tempo with no indication of near-term de-escalation; institutional responses (arrests, deployments) are reactive rather than strategic.
Key Developments
Verification Note: Open web sources available for July 1–2, 2026 are insufficient to reliably document 6–10 specific incidents within the last 24–48 hours. GeoBit's event signals (combat, assassination, civil disapproval) indicate ongoing activity in late June–early July, but cannot be corroborated with time-stamped, location-specific reporting within this window. Recent verified incidents from late June include:
- Morelia, Michoacán (June 25): Security forces arrested Ernesto Rafael "N" ("Sierra 1"), identified as a leader of Cártel de Altozano—a significant cartel leadership capture.
- Zinapécuaro, Michoacán (June 25): Joint federal and state operation arrested nine individuals posing as Guardia Civil, linked to organized crime infiltration of security apparatus.
- Los Héroes Tecámac, State of Mexico (June 25): Armed hostage-taking involving six family members (three minors) required deployment of 100+ security personnel across multiple government levels.
- Cuauhtémoc, Mexico City (June 25): Prosecution of two individuals for aggravated extortion against a Foreign Ministry official, indicating targeting of state personnel.
- Mexico City (late June): Large CNTE teacher union protest near Estadio Azteca blocked major avenue, demanding salary and pension reforms; authorities deployed thousands of agents.
GeoBit event signals for July 1–2 reference small-arms combat (counsel and deputies), assassination (criminal actor), civil disapproval (multiple authorities, Oaxaca), and reduced relations (community, Mexican entities), suggesting active conflict and institutional tension, but specific incident locations and times require confirmation through multi-source corroboration.
Highest-Risk Areas
San Luis Potosí (risk 100) and Chihuahua (85.3) remain the critical hotspots, followed closely by the State of Mexico (76.6), Mexico City (74.2), and Baja California (73.9). These five jurisdictions account for the highest concentration of criminal violence, including cartel combat, trafficking operations, and enforcement killings. San Luis Potosí's maximum risk score reflects its role as a major transit corridor and contested territory between rival criminal organizations; Chihuahua's sustained high score reflects ongoing violence tied to supply-chain control and border dynamics. The State of Mexico and Mexico City's elevated rankings reflect spillover violence, extortion networks targeting urban businesses and government officials, and infiltration of security institutions. Yucatán (71.6) and Sonora (71.6) round the second tier, indicating that risk is geographically dispersed rather than concentrated—a factor complicating protective strategies for multinational operations.
How GeoBit Would Assist
Security teams should deploy AOI (Area-of-Interest) Monitoring & Early Warning on high-risk states to receive real-time alerts on combat, kidnapping, or cartel activity near company sites or personnel transit routes. OSINT fusion (X/Twitter, Telegram, radio SIGINT) combined with event-feed aggregation would fill the current gap in 24–48-hour incident confirmation, enabling faster duty-of-care response. Routing & Network Analysis can identify alternative transport corridors and safe zones in contested regions; conflict & actor mapping clarifies which organizations control specific territories, informing evacuation and access protocols.
7-Day Outlook
Violence levels are expected to remain elevated across the northern and central corridor through the coming week. No major organizational realignment or state enforcement surge is signaled for the near term; tactical arrests (e.g., cartel leaders) may provoke localized retaliation. Personnel and asset security protocols should remain at heightened vigilance in San Luis Potosí, Chihuahua, and State of Mexico through July 9.
Highest-Risk Areas — Ranked
| # | State / Region | Risk |
|---|---|---|
| 1 | San Luis Potosí | 100 |
| 2 | Chihuahua | 85.3 |
| 3 | State of Mexico | 76.6 |
| 4 | Mexico City | 74.2 |
| 5 | Baja California | 73.9 |
| 6 | Puebla | 73.8 |
| 7 | Chiapas | 73.7 |
| 8 | Jalisco | 73.6 |
| 9 | Tabasco | 73.2 |
| 10 | Yucatán | 71.6 |
| 11 | Sonora | 71.6 |
| 12 | Campeche | 71.4 |
Sources
Previous Daily Briefs
A new Mexico brief is written every day — each with its own risk map and downloadable CSV. Here's the last week; use the calendar to go further back.
📅 Browse every day by calendar →
Highlighted days have a brief. Tap a day for that day's map & analysis, or “csv” for that day's dataset ($5).