Situation Summary
New Zealand remains a low-threat environment (global rank #149) but faces a sharp increase in cyber-driven exposure and localized public-order incidents concentrated in Auckland and Canterbury. The past 48 hours have surfaced a large-scale fleet-tracking data breach affecting over 30,000 vehicles and thousands of drivers nationwide, alongside elevated armed-police deployments and vehicle-crime arrests in Auckland. High-level diplomatic activity (India–New Zealand PM visit) has introduced temporary security complexity. The overall trajectory is stable but warrants close monitoring of cyber-asset exposure and regional law-enforcement activity.
Key Developments
- Auckland, vehicle-crime arrests – 8–10 July 2026:
New Zealand Police arrested 14 individuals across multiple stolen-vehicle incidents within 48 hours, including an overnight incident around 02:00 in West Auckland. Incidents involved vehicle thefts and related offences.
- Nationwide, Teletrac Navman fleet-tracking data breach – 8–9 July 2026:
Active marketing of alleged GPS telemetry data affecting over 2,988 organisations across Australia and New Zealand; approximately 670,000 position records, vehicle registrations, VINs, and driver licence numbers are reportedly available via encrypted channels for ongoing access.
- New Zealand, fleet-operations cyber exposure – ongoing as of 12 July 2026:
The Teletrac Navman breach is confirmed to impact more than 30,000 continuously tracked vehicles and thousands of drivers in New Zealand. Exposed data includes registration, personal driver information, and real-time location telemetry, creating corporate liability, privacy, and physical-security risks for affected organisations.
- Auckland, heightened security operations – 10–11 July 2026:
Prime Minister Narendra Modi's official visit prompted enhanced protective measures around key venues and transport routes. Authorities managed high-level diplomatic movements, protest management, and crowd-control operations.
- Auckland North Shore, armed police deployment and school lockdowns – around 11 July 2026:
Specialist and armed police teams were deployed to an incident on the North Shore; some schools were placed into lockdown as part of the operation, indicating a serious localized police response.
- Titirangi, Auckland, structure fire response – 11 July 2026, 00:02:
Fire and Emergency New Zealand responded to a residential or commercial fire just after midnight. No indication of wider infrastructure disruption beyond the immediate locality.
Highest-Risk Areas
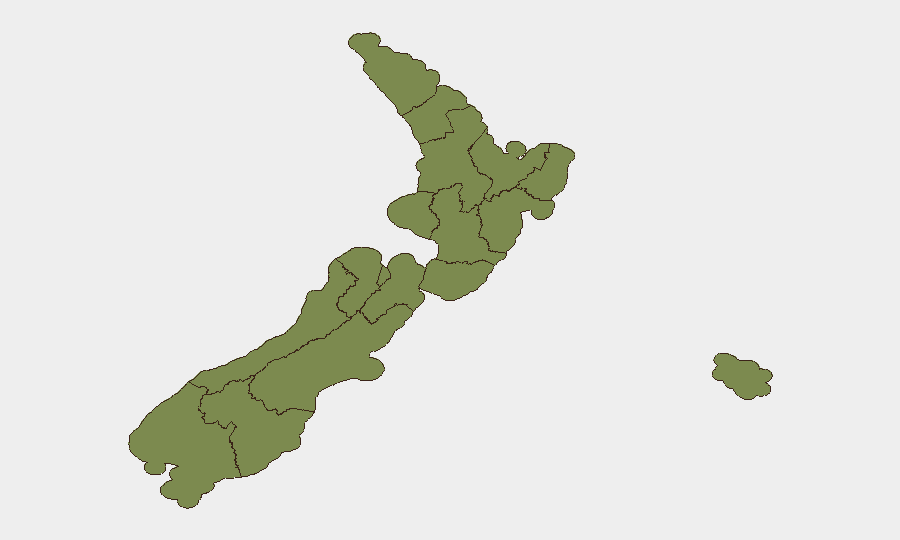
Canterbury (risk 31.5) and Wellington (risk 24.9) drive the majority of tracked threat events, followed by Auckland (21.5). The concentration in Canterbury and Wellington reflects investigative activity, property damage, and public-statement signals; Auckland's ranking is driven by vehicle crime, cyber exposure, and recent armed-police operations. Remaining regions present minimal risk (under 5 each). Organisations with fleet operations, supply-chain assets, or personnel in Canterbury and Auckland should prioritise asset-tracking verification and incident-response readiness.
How GeoBit Would Assist
Security teams should deploy AOI (Area-of-Interest) Monitoring & Early Warning on Canterbury, Wellington, and Auckland to detect emerging incidents and threat escalation. Intel Sweep and OSINT fusion (X/Twitter, Telegram, public statements) enable real-time corroboration of protest activity, property seizure, and investigative signals. Cyber and network-actor analysis can map the Teletrac Navman breach—identifying compromised asset registries, downstream exposure, and threat-actor infrastructure—while alternative-route/journey planning assists teams rerouting fleet movements or personnel away from affected areas.
7-Day Outlook
Near-term risk remains low to moderate. Vehicle-crime arrests may continue in Auckland as police respond to theft clusters; however, the diplomatic visit concludes this weekend, reducing high-level security complexity. Organisations dependent on fleet-tracking or location-based services should conduct urgent breach-impact assessments and credential rotation to mitigate ongoing cyber exposure. Monitoring of Canterbury and Wellington event signals should continue weekly.
Highest-Risk Areas — Ranked
| # | State / Region | Risk |
|---|---|---|
| 1 | Canterbury | 31.5 |
| 2 | Wellington | 24.9 |
| 3 | Auckland | 21.5 |
| 4 | Taranaki | 4.9 |
| 5 | Southland | 4.9 |
| 6 | Marlborough | 3.2 |
| 7 | Otago | 3.2 |
| 8 | Chatham Islands | 1.5 |
| 9 | Northland | 1.5 |
| 10 | Waikato | 1.5 |
| 11 | Bay of Plenty | 1.5 |
| 12 | Manawatū-Whanganui | 1.5 |
Sources
Previous Daily Briefs
A new New Zealand brief is written every day — each with its own risk map and downloadable CSV. Here's the last week; use the calendar to go further back.
📅 Browse every day by calendar →
Highlighted days have a brief. Tap a day for that day's map & analysis, or “csv” for that day's dataset ($5).
Atlas — our AI intelligence desk — emails them this snapshot personally. Nothing else, no list.