Situation Summary
South Africa's composite threat score of 25 places it at rank #62 globally, with 1,629 tracked events reflecting sustained volatility across multiple security domains. The past 48 hours have witnessed a sharp spike in armed violence, including mass shootings in the Western Cape (11+ dead) and multiple shooting incidents across Johannesburg's commercial and residential areas, alongside police operations targeting firearms and narcotics. The concurrent arrest of an immigrant, ongoing student investigations, and statements from parliament and community figures signal underlying political and social friction that may amplify security risks in coming days.
Key Developments
- Western Cape (Gugulethu, Kayamandi, Manenberg) – 27 July 2026: Mass shooting incidents across three neighbourhoods resulted in at least 11 deaths and multiple injuries, including two police officers in Kayamandi; Provincial Serious and Violent Crime Unit investigation ongoing with no arrests or confirmed motives.
- Johannesburg (Buccleuch Interchange, N3/M1/Woodmead) – 28 July 2026: Three armed suspects shot dead in police shootout following high-speed chase linked to attempted robbery; N3 north to M1 south traffic shut down, causing major congestion.
- Johannesburg (Sandown/Sandton, Katherine Street) – 28 July 2026: Shooting incident beneath bridge closure; incident followed security pursuit after attempted cellphone robbery in nearby Petervale; heightened alert issued for motorists.
- Johannesburg (Winifred Mandela Precinct Shopping Centre, Sandton) – 28 July 2026: Temporary security alert and precinct closure following reports of armed robbery and suspect movement; authorities later clarified no active shooting; heightened security posture maintained.
- Johannesburg (Kew, Sandton corridor) – 27–28 July 2026: Targeted vehicle shooting killed a female occupant and wounded the driver; part of ongoing pattern of vehicle-targeted attacks in Sandton/Kew area.
- Johannesburg (Protea Glen, Soweto) – 28 July 2026, early hours: Off-duty female Johannesburg Metropolitan Police Department (JMPD) officer fatally shot in incident involving two off-duty female officers; approximately 3:30 a.m. in Glenridge Extension 16.
- Johannesburg (Bryanston) – 27–28 July 2026: City of Johannesburg announced intensified enforcement against hijacked properties, with 17 properties under investigation and recent arrest linked to property hijacking.
- Johannesburg (Eldorado Park, Soweto) – 28 July 2026: Intelligence-led police operation resulted in arrest of 57-year-old suspect and seizure of unlicensed firearm, ammunition, and narcotics; part of broader firearms and drug-related crackdown.
Highest-Risk Areas
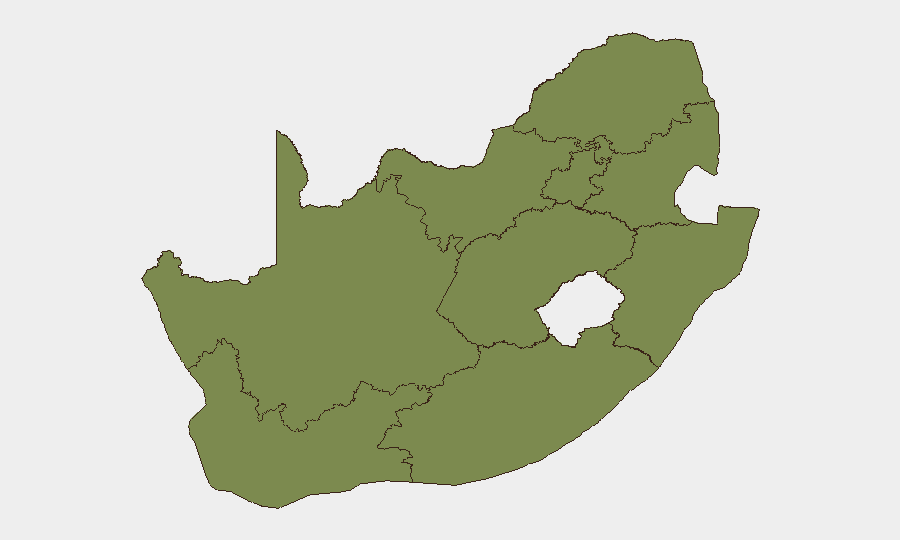
Western Cape dominates the sub-national risk profile with a composite score of 32.8—more than double that of Gauteng (13.9)—driven primarily by mass shootings and gang violence in Cape Town's townships and periurban areas. Gauteng's secondary risk level (13.9) reflects concentrated armed robbery, vehicle targeting, and police shootouts across Johannesburg's high-value commercial and residential zones (Sandton, Kew, Bryanston, Soweto). Eastern Cape (11.1) and KwaZulu-Natal (7.0) show lower but material risk; remaining provinces fall below 4.0.
How GeoBit Would Assist
Security and duty-of-care teams operating in South Africa should employ AOI Monitoring & Early Warning to track high-risk zones in the Western Cape and Gauteng with real-time alerting on armed violence, roadblock activity, and police operations. OSINT Fusion & Corroboration (X/Twitter, Telegram, local news feeds, radio SIGINT) will triangulate emerging incidents before mainstream media cycles and clarify motive and actor patterns in mass-shooting clusters. Routing & Network Analysis enables continuous alternative-route planning for staff commuting in Johannesburg and Cape Town, accounting for live closure and congestion data.
7-Day Outlook
Armed violence and robbery are likely to persist at elevated levels across the Western Cape and Gauteng through early August, with police enforcement operations continuing to generate secondary risks (shootouts, cordons, traffic disruption). Concurrent political activity (parliament statements, community demonstrations) and immigration-related tensions may drive secondary flashpoints in townships and city centres; monitor sentiment and actor statements via OSINT for escalation signals.
Highest-Risk Areas — Ranked
| # | State / Region | Risk |
|---|---|---|
| 1 | Western Cape | 32.8 |
| 2 | Gauteng | 13.9 |
| 3 | Eastern Cape | 11.1 |
| 4 | KwaZulu-Natal | 7 |
| 5 | Free State | 3.2 |
| 6 | Limpopo | 3.1 |
| 7 | Northern Cape | 2.8 |
| 8 | North West | 2.8 |
| 9 | Mpumalanga | 2.8 |
Sources
Previous Daily Briefs
A new South Africa brief is written every day — each with its own risk map and downloadable CSV. Here's the last week; use the calendar to go further back.
📅 Browse every day by calendar →
Highlighted days have a brief. Tap a day for that day's map & analysis, or “csv” for that day's dataset ($5).
Atlas — our AI intelligence desk — emails them this snapshot personally. Nothing else, no list.