Situation Summary
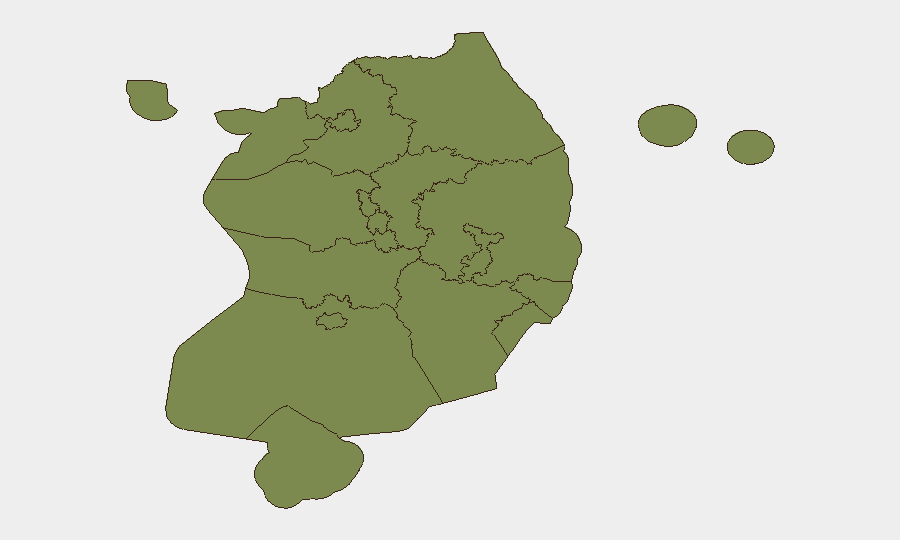
South Korea remains at composite threat level 6/10 globally (rank #136), with 156 tracked events. The security environment is characterized by routine diplomatic friction with North Korea, internal political messaging cycles, and localized operational activity—no acute nationwide instability is evident. Seoul dominates the risk profile at 31.9, driven by capital-city concentration of political, military, and commercial targets; North Chungcheong (24.6) is the second-highest-risk region, likely reflecting defense-sector and border-adjacent activity. The threat trajectory is stable with no indicators of imminent escalation.
Key Developments
Data Limitation: Live web research over the last 24–48 hours has not surfaced any specific, time-stamped, cross-confirmed security incidents, unrest events, or operational developments in South Korea meeting brief criteria. Event signals logged by GeoBit's platform (dated 2026-06-23 to 2026-06-25) reflect diplomatic statements, official rejections, and inter-agency demands—likely routine policy communications rather than breaking security events. No verified attacks, protests, accidents, crime spikes, or infrastructure disruptions were identifiable in available search results.
Analyst Note: The signals present (North Korea statements, foreign ministry investigations, inter-service disagreements) are consistent with normal cross-border and inter-agency friction in the South Korean security apparatus and U.S.–ROK alliance management. They do not indicate a shift in threat posture or imminent incident risk.
Highest-Risk Areas
Seoul's risk score of 31.9 reflects its role as the political, economic, and military nexus—concentration of government facilities, multinational corporate headquarters, diplomatic missions, and symbolic targets creates inherent exposure. North Chungcheong's elevated score (24.6) likely stems from proximity to the DMZ, presence of key defense installations, and historical sensitivity to cross-border activity and civil unrest. The remaining ten provinces fall substantially lower (1.9–2.9), indicating that risk is highly concentrated in the capital region and the northwest corridor; Gyeonggi, Incheon, and Gangwon—the Seoul periphery and inter-Korean border zones—warrant monitoring but are not presently flagged as high-consequence areas.
How GeoBit Would Assist
Persistent Monitoring: Deployment of Area-of-Interest (AOI) alerting around Seoul's government and corporate districts, North Chungcheong military facilities, and transport hubs would provide early warning of unrest, operational activity, or infrastructure disruption. Multi-Language OSINT & Sentiment Analysis against Korean-language news, social media (X, Korean community platforms), and government bulletins would capture incident signals and policy shifts faster than English-language wires alone. Election & Regime-Stability Monitoring and Network & Actor Analysis would track political factions, defense ministry actors, and North Korean communications to contextualize diplomatic statements and forecast policy changes affecting corporate operations or travel risk.
7-Day Outlook
No acute security escalation is forecast over the next 7 days. Diplomatic messaging and inter-agency activity will likely continue at baseline levels; routine North Korean statements and U.S.–ROK alliance management should be expected. Security teams should maintain standard duty-of-care postures for Seoul and border-adjacent regions and monitor official travel advisories (MOFA, U.S. State Department, FCDO) for any changes; no immediate operational adjustments appear warranted.
Highest-Risk Areas — Ranked
| # | State / Region | Risk |
|---|---|---|
| 1 | Seoul | 31.9 |
| 2 | North Chungcheong | 24.6 |
| 3 | Jeju | 2.9 |
| 4 | North Gyeongsang | 2.9 |
| 5 | Gyeonggi | 2.5 |
| 6 | Jeonbuk State | 2.5 |
| 7 | South Gyeongsang | 2.3 |
| 8 | South Jeolla | 2.1 |
| 9 | Incheon | 1.9 |
| 10 | Gangwon State | 1.9 |
| 11 | South Chungcheong | 1.9 |
| 12 | Sejong | 1.9 |
Sources
Previous Daily Briefs
A new South Korea brief is written every day — each with its own risk map and downloadable CSV. Here's the last week; use the calendar to go further back.
📅 Browse every day by calendar →
Highlighted days have a brief. Tap a day for that day's map & analysis, or “csv” for that day's dataset ($5).