Situation Summary
Sudan remains engulfed in active civil conflict with a composite threat score of 100, ranking sixth globally. The conflict is characterized by conventional military operations, intercommunal violence, and active anti-government protest suppression, with 27 tracked events recorded across the country. The security environment shows no signs of de-escalation, with simultaneous threats spanning military clashes, state-actor involvement (notably Iranian operations), and internal instability. Trajectory remains unstable with high potential for sudden localized deterioration.
Key Developments
Reporting Limitations: GeoBit's live web research (last 24–48 hours) has not yielded verifiable, time-stamped incident reports specific to June 27–28, 2026. Recent signals include:
- Conventional military operations (2026-06-28, location unspecified): Active combat reported without granular geographic or tactical detail.
- Iran–Sudan military activity (2026-06-27): Alleged Iranian military involvement or coordination detected; specific incident location and nature require field corroboration.
- Protest suppression (2026-06-28, multiple instances): Sudanese security forces engaged with civilian protesters; geographic specificity limited in current intelligence.
- US diplomatic pressure (2026-06-27): Threat-level warnings issued by US toward Sudan and Sudanese actors, likely tied to foreign interference or human-rights violations.
- Environmental hazards (recent): Wildfires affecting Sudan and bordering Ethiopia; secondary health risk (Sudan virus disease reported in Uganda region) represents epidemiological monitoring concern.
Note: Incident-level detail from dedicated field-security networks, NGO reporting, or government travel advisories should be consulted for operational decision-making in specific locations.
Highest-Risk Areas
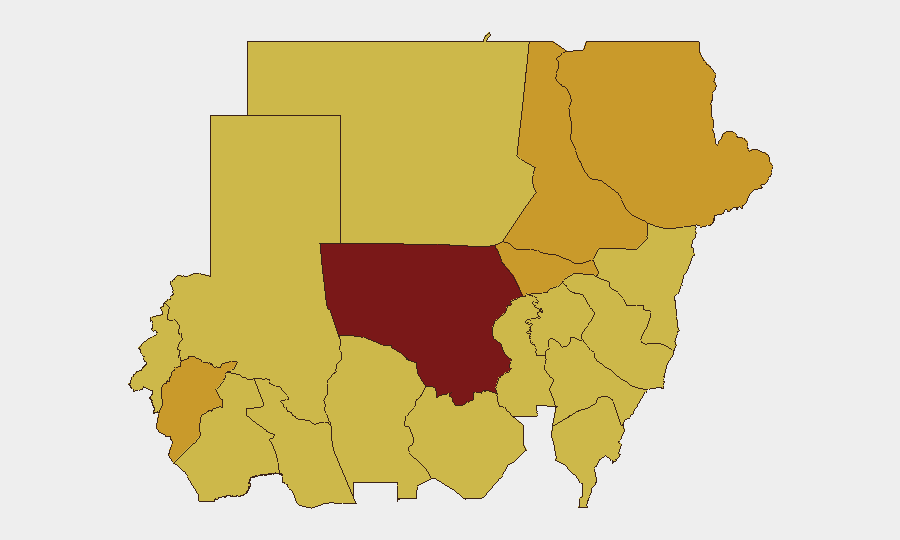
North Kordofan State (risk 100) is the epicenter, reflecting sustained conventional military conflict and likely the primary driver of Sudan's global ranking. The Nile River corridor—encompassing River Nile State and Al Khartum (both risk 71)—presents compounded risk from military operations, critical infrastructure vulnerability, and urban instability affecting the capital region and its surroundings. Darfur and eastern states (Central Darfur, South Darfur, West Kordufan; all risk 70–71) remain active conflict zones with high civilian exposure. The risk clustering in the north and east indicates a geographically dispersed but coordinated conflict landscape rather than a single hotspot, complicating movement and protective measures.
How GeoBit Would Assist
Security teams with personnel or assets in Sudan should employ AOI (Area-of-Interest) Monitoring & Early Warning on high-risk states to receive real-time alerting on military movements, protest activity, and security incidents. Battle Mapping and force-structure tracking provide tactical context for understanding active military positions and likely safe corridors. GIS & Spatial Analysis combined with Routing & Network Analysis enables alternative-route planning to avoid active conflict zones and checkpoint congestion, critical for duty-of-care operations and casualty prevention.
7-Day Outlook
No reliable indicators suggest near-term military de-escalation or reduction in state security operations against civilians. Expect continued conventional military activity in North Kordofan and sustained protest-response operations in urban centers including Al Khartum. Personnel movement planning should assume high volatility and maintain contingency evacuation readiness.
Highest-Risk Areas — Ranked
| # | State / Region | Risk |
|---|---|---|
| 1 | North Kordofan State | 100 |
| 2 | River Nile State | 71 |
| 3 | Al Khartum | 71 |
| 4 | Red Sea State | 71 |
| 5 | Central Darfur State | 71 |
| 6 | Blue Nile | 70 |
| 7 | Aj Jazira | 70 |
| 8 | Al Qadarif State | 70 |
| 9 | Kassala State | 70 |
| 10 | Sennar State | 70 |
| 11 | South Darfur State | 70 |
| 12 | West Kurdufan State | 70 |
Sources
Previous Daily Briefs
A new Sudan brief is written every day — each with its own risk map and downloadable CSV. Here's the last week; use the calendar to go further back.
📅 Browse every day by calendar →
Highlighted days have a brief. Tap a day for that day's map & analysis, or “csv” for that day's dataset ($5).