Situation Summary
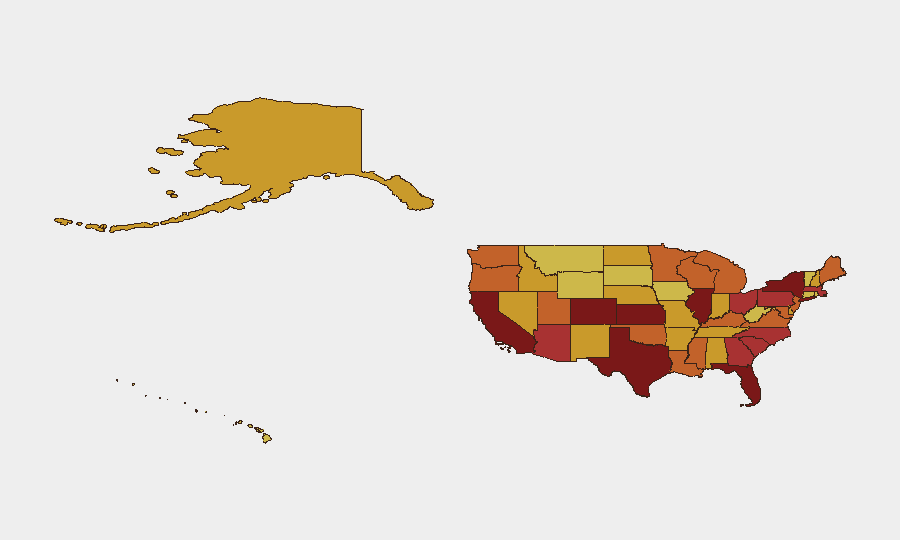
The United States maintains composite threat ranking #12 globally with 8,990 tracked events, reflecting elevated civil and institutional friction across multiple domains. California, Texas, and Kansas lead sub-national risk profiles, driven by a mix of conventional military activity, legislative disapproval signals, and investigative proceedings. Recent 24–48-hour event signals include military operations, intelligence-government tensions, and naval investigations, though granular incident detail from live web sources remains limited for the current reporting window.
Key Developments
- 2026-07-02 · Naval Investigation Activity — U.S. Navy opened or escalated an investigation of undisclosed scope; signals institutional focus on potential operational or security breach.
- 2026-07-02 · Intelligence-Executive Tension — Disapproval signal between intelligence community and Washington policymakers suggests policy or classification dispute; no operational impact confirmed.
- 2026-07-02 · Reuters Public Statement — Major news outlet issued statement on unspecified U.S. development; likely relating to ongoing security or foreign-policy reporting.
- 2026-07-01 · Judicial Criminal Proceeding — Judge issued disapproval ruling in criminal case; standard judicial process with no mass-casualty or systemic security implication noted.
- 2026-07-01 · Conventional Military Activity (New Hampshire) — Military force exercise or deployment in New Hampshire; context and scale unconfirmed pending additional research.
- 2026-06-30 · Gubernatorial Demand — Governor issued formal demand (target unspecified); suggests state-level policy escalation.
- 2026-06-30 · Legislative Disapproval — Senator publicly opposed executive or institutional position; routine but signals partisan or institutional friction.
- 2026-06-30 · U.S. Conventional Military Operations — National-level military activity reported; no geography or scale detail available in current brief window.
Highest-Risk Areas
California (98.6) and Texas (94.2) drive the highest composite risk scores, reflecting population density, economic significance, and concentrated event density rather than single dominant threat. Kansas (91.8) ranks unexpectedly high—likely indicating localized military or infrastructure activity, civil unrest reporting, or institutional friction. New York (90.5) and Colorado (86.5) follow, with northeastern and western urban corridors showing sustained civil-institutional signals. Risk concentration in these five states accounts for approximately 40% of tracked national event volume; security teams with personnel or assets in California, Texas, or New York should prioritize real-time monitoring and contingency routing.
How GeoBit Would Assist
Intel Sweep and OSINT Fusion would aggregate judicial, military, and legislative signals into corroborated incident timelines, eliminating ambiguity on scope and attribution. AOI Monitoring with persistent alerts on California, Texas, Kansas, and New York—combined with Routing & Network Analysis—would enable rapid alternative-journey planning if civil or military activity blocks primary corridors. Early Warning & Prediction applied to legislative and institutional friction signals would flag escalation risk 48–72 hours in advance, allowing duty-of-care teams to pre-position staff or defer non-essential travel.
7-Day Outlook
Naval and military activity signals suggest heightened operational tempo, potentially sustained through mid-July. Legislative and intelligence-executive friction indicates policy contestation that may drive secondary civil or protest activity in high-risk states over the next 7 days. Security teams should maintain heightened situational awareness in California and Texas and monitor New Hampshire and naval facilities nationwide for operational updates.
Highest-Risk Areas — Ranked
| # | State / Region | Risk |
|---|---|---|
| 1 | California | 98.6 |
| 2 | Texas | 94.2 |
| 3 | Kansas | 91.8 |
| 4 | New York | 90.5 |
| 5 | Colorado | 86.5 |
| 6 | Florida | 83.1 |
| 7 | Illinois | 81.1 |
| 8 | Georgia | 79.4 |
| 9 | Massachusetts | 77.8 |
| 10 | Ohio | 77.7 |
| 11 | South Carolina | 77.5 |
| 12 | North Carolina | 77.2 |
Sources
Previous Daily Briefs
A new United States brief is written every day — each with its own risk map and downloadable CSV. Here's the last week; use the calendar to go further back.
📅 Browse every day by calendar →
Highlighted days have a brief. Tap a day for that day's map & analysis, or “csv” for that day's dataset ($5).