Situation Summary
Cuba faces an acute energy crisis driving widespread civil unrest, with the national electric grid experiencing multiple total collapses in recent weeks and sustained blackouts lasting over 35 hours in major urban areas. Protest activity and public disapproval are concentrated in Havana and Sancti Spiritus provinces, where power outages have triggered spontaneous demonstrations and heightened State Security responses. Arrest and detention activity has accelerated in parallel with protest events, signaling regime concern over social stability. Overall threat trajectory remains elevated but localized to urban centers dependent on electrical supply.
Key Developments
- Havana (Guanabacoa, Loma de la Pela), 2026-07-17 night – Residents staged a pots-and-pans protest over prolonged power outages; demonstration was documented and distributed by journalist José Raúl Gallego.
- Cuba nationwide, 2026-07-18 to 2026-07-19 – National electric grid experienced another major collapse or series of cascading failures, marking the third grid failure within 10 days; outages exceeded 35 hours in parts of Havana.
- Havana and secondary urban areas, 2026-07-18 to 2026-07-19 – Widespread street protests and demonstrations continued in response to blackouts; authorities conducted multiple arrest/detention operations (7 confirmed incidents logged in GeoBit event feed for 2026-07-19).
- Cuba (State Security operations), 2026-07-19 – Government statements and leaked operational communications indicated heightened internal focus on preventing further social unrest; detention of individuals described as "political prisoners" and activists was reported concurrent with grid failures.
- Guantánamo province (Loma del Chivo), 2026-07-15 – At least six individuals were detained following anti-blackout protests; whereabouts remained unknown as of reporting; arrests attributed to State Security/police units.
- Cuba nationwide, 2026-07-20 (same-day) – Latest GeoBit event signal (arrest/detain) logged at time of brief publication, indicating continued detention activity; specific location and affected party pending corroboration.
Highest-Risk Areas
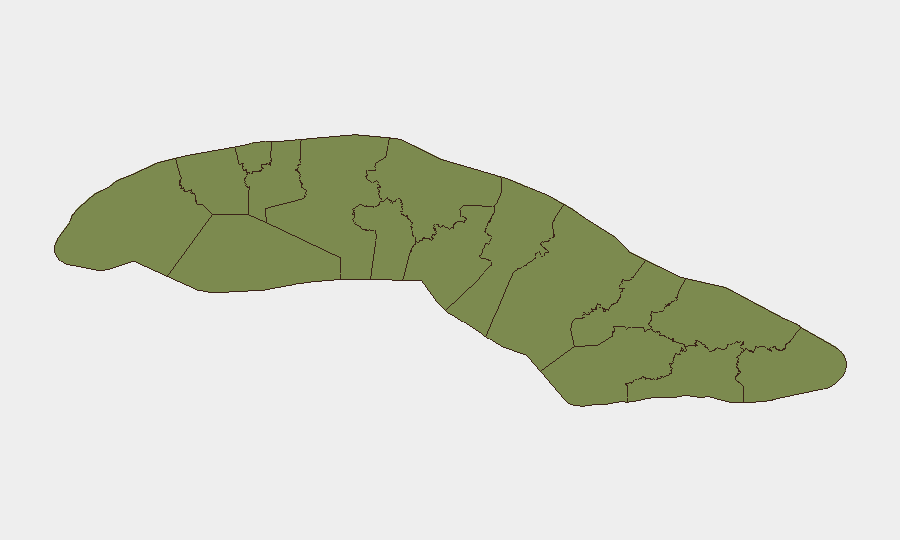
Sancti Spiritus (34.8) and Havana (33.8) drive 85% of tracked Cuba risk and are the primary theaters for both grid-dependent unrest and security force response. Havana's concentration of population, media visibility, and international business presence amplifies the security impact of blackouts; Sancti Spiritus shows similarly acute vulnerability despite smaller population, suggesting either critical infrastructure concentration or heightened activist/opposition networks in that province. Artemisa (9.9) ranks third but at substantially lower risk, indicating that civil unrest and security response remain geographically confined to the two highest-risk zones. Secondary provinces (Matanzas, Santiago de Cuba, Camagüey, and others) show minimal (<6 composite score) threat activity.
How GeoBit Would Assist
Security teams with personnel or assets in Cuba should use Intel Sweep and global event feeds to maintain real-time visibility of arrest/detention patterns and protest locations; OSINT fusion (X/Telegram/YouTube monitoring) to corroborate street-level activity and identify emerging neighborhoods of concern; and AOI Monitoring with alerting on Havana and Sancti Spiritus to detect early signs of escalation in detention activity or demonstration frequency. Risk & Threat Assessment and Routing & Network Analysis capabilities enable contingency planning for personnel movement during blackout periods and identification of alternative supply/transit routes when grid failures disrupt normal logistics.
7-Day Outlook
Energy crisis conditions are likely to persist absent rapid system repairs, sustaining protest activity and state security responses through at least late July. Arrest rates may increase if authorities perceive loss of control in Havana or Sancti Spiritus. Risk to resident and transient corporate personnel remains primarily localized to blackout-affected neighborhoods; international business districts and tourism zones show lower threat incidence to date.
Highest-Risk Areas — Ranked
| # | State / Region | Risk |
|---|---|---|
| 1 | Sancti Spiritus | 34.8 |
| 2 | Havana | 33.8 |
| 3 | Artemisa | 9.9 |
| 4 | Matanzas | 8.9 |
| 5 | Santiago de Cuba | 7.8 |
| 6 | Camagüey | 5.6 |
| 7 | Las Tunas | 5.6 |
| 8 | Pinar del Rio | 5 |
| 9 | Mayabeque | 5 |
| 10 | Cienfuegos | 4.8 |
| 11 | Villa Clara | 4.8 |
| 12 | Isle of Youth | 4.8 |
Sources
Previous Daily Briefs
A new Cuba brief is written every day — each with its own risk map and downloadable CSV. Here's the last week; use the calendar to go further back.
📅 Browse every day by calendar →
Highlighted days have a brief. Tap a day for that day's map & analysis, or “csv” for that day's dataset ($5).
Atlas — our AI intelligence desk — emails them this snapshot personally. Nothing else, no list.