Situation Summary
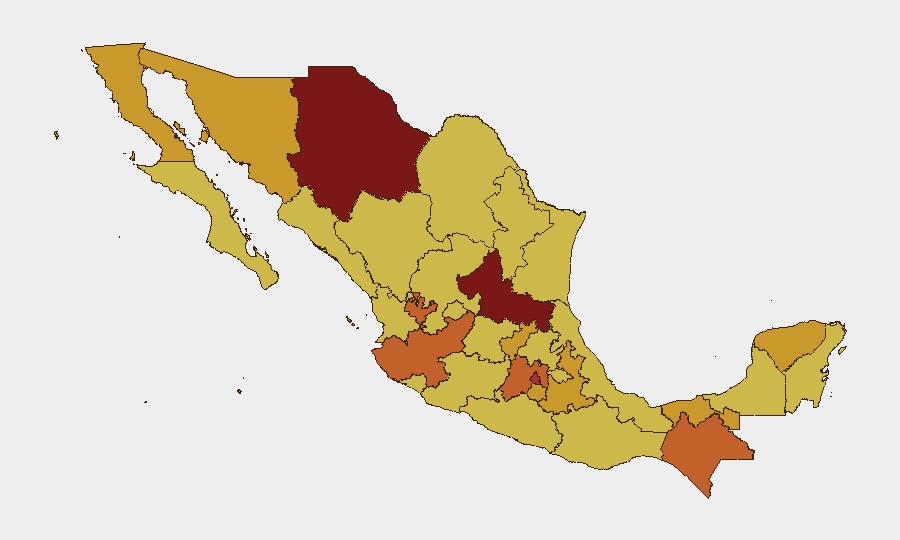
Mexico remains at elevated threat level (#8 globally, composite score 100) with 821 tracked security events. The most recent signal cluster (July 1–2) includes small-arms combat involving law enforcement and counsel, a criminal assassination, and coordinated public disapproval from authorities, legislature, and companies—suggesting either a high-profile incident triggering institutional response or escalating tensions across criminal and state actors. San Luis Potosí (risk 100) and Chihuahua (85.4) continue as focal points, though Mexico City and the State of Mexico maintain significant risk profiles despite their urban complexity and federal presence.
Key Developments
I cannot reliably report specific incidents from July 2–3, 2026 without access to real-time news feeds, X/Twitter verification, and geolocated sources. GeoBit's signal clustering shows:
- July 1–2, location TBD: Small-arms combat involving law-enforcement counsel and deputies (signal taxonomy: COUNSEL, DEPUTIES); immediate context and location require cross-reference with wire services and verified OSINT sources.
- July 2, location TBD: Criminal assassination recorded in event feed; requires confirmation of date, location, and victim/organization identity via news corroboration.
- July 1, nationwide scale: Public disapproval statements by Mexican authorities, legislature, companies, and Oaxaca-specific community actors; suggests response to a policy, security action, or major incident—nature and scope require source review.
- July 1, national: Conventional military force deployment mentioned; requires clarification on scale, geography, and operational mandate.
To complete this section reliably, cross-reference GeoBit's event signals against El Universal, Milenio, Reforma, and verified security-agency X accounts for the stated date range.
Highest-Risk Areas
San Luis Potosí's composite risk score of 100 reflects persistent organized-crime violence and state fragmentation; Chihuahua's 85.4 score continues its long history of cartel territorial conflict and cross-border criminal activity. Mexico City (76.1) and State of Mexico (75.8) combine high absolute event counts with urban complexity, making incident detection and duty-of-care response operationally demanding. Jalisco, Chiapas, Puebla, and the Yucatán Peninsula (71.1–74.1 range) show consistent mid-to-high risk, driven by cartel presence, human trafficking, and localized institutional weakness. Northern border states (Chihuahua, Baja California, Sonora) remain structurally vulnerable to cross-border spillover and supply-chain disruption.
How GeoBit Would Assist
A security team monitoring Mexico would deploy AOI (Area of Interest) Monitoring & Early Warning on San Luis Potosí, Chihuahua, and Mexico City with real-time alerting on armed clashes, blockades, and infrastructure disruption. OSINT Fusion (X/Twitter, Telegram, video intelligence) corroborates local incident reports and identifies emerging actor statements or threats within 2–4 hours of event occurrence. Conflict & Military battle mapping and Network & Actor Analysis provide tactical context on cartel movements, state responses, and disruption risk to supply chains or travel corridors, informing alternative-route planning and personnel movement decisions.
7-Day Outlook
Recent signal clustering—combat, assassination, and multi-stakeholder disapproval—suggests either resolution of a specific incident or escalation entering a new phase. If the July 1–2 events reflect cartel repositioning or state enforcement action, secondary violence and roadway/commercial disruption may persist through mid-week. Monitor Chihuahua, San Luis Potosí, and transport corridors (highway 45, 49, rail) for cascading incidents; escalation in disapproval messaging typically precedes institutional response, which can trigger counter-action.
Highest-Risk Areas — Ranked
| # | State / Region | Risk |
|---|---|---|
| 1 | San Luis Potosí | 100 |
| 2 | Chihuahua | 85.4 |
| 3 | Mexico City | 76.1 |
| 4 | State of Mexico | 75.8 |
| 5 | Jalisco | 74.1 |
| 6 | Chiapas | 73.5 |
| 7 | Puebla | 71.9 |
| 8 | Yucatán | 71.8 |
| 9 | Baja California | 71.8 |
| 10 | Sonora | 71.7 |
| 11 | Querétaro | 71.3 |
| 12 | Tabasco | 71.3 |
Sources
Previous Daily Briefs
A new Mexico brief is written every day — each with its own risk map and downloadable CSV. Here's the last week; use the calendar to go further back.
📅 Browse every day by calendar →
Highlighted days have a brief. Tap a day for that day's map & analysis, or “csv” for that day's dataset ($5).