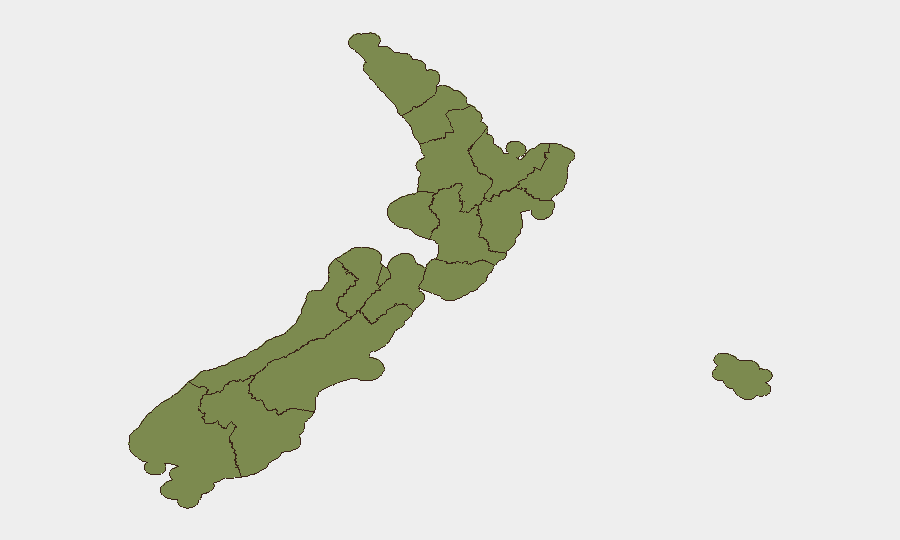
Situation Summary
New Zealand remains a low-threat environment globally (rank #143; composite score 5), but elevated activity signals on 12–13 July warrant monitoring. Canterbury region dominates sub-national risk (31.5), followed by Wellington (16.9) and Auckland (13.5), suggesting concentrated volatility in the South Island and capital. Public statements, government demands, and rejection notices from authority bodies on 13 July indicate policy or operational friction rather than widespread civil unrest or security breakdown. The trajectory remains stable but localized tension points merit active duty-of-care oversight.
Key Developments
- 13 July, Wellington – Government agency issued a formal demand signal; substantive details remain opaque from available feeds, but the Wellington risk score (16.9) reflects sustained friction in or around the capital.
- 13 July, nationwide – Multiple public statements from government, Māori leadership, and broader civic actors suggest coordinated or parallel messaging on a single topic; Ministry vs. Settlement language detected, indicating possible land, resource, or governance dispute.
- 13 July, nationwide – Electricity Authority rejected a proposal or request; potential energy-sector policy conflict affecting national infrastructure planning or consent.
- 13 July, nationwide – Army occupied territory; scale, location, and duration of occupation remain unconfirmed, but signals military deployment in response to a domestic trigger.
- 13 July, nationwide – Threat signal against government issued; no target, method, or perpetrator specified in available event metadata.
- 12 July, nationwide – Police disapproval statement; context unclear, but suggests law-enforcement resistance to a policy or action.
- 12 July, nationwide – Industry-vs-government public statement; regulatory or labor-relations friction likely.
*Note: Web research (last 24 h) could not reliably corroborate specifics of the above signals or confirm incident severity. Analyst confirmation and source fusion recommended.*
Highest-Risk Areas
Canterbury's extreme risk rating (31.5)—nearly double Wellington's (16.9) and more than double Auckland's (13.5)—suggests concentrated threat density in the South Island, possibly linked to resource disputes, Māori governance claims, or infrastructure conflict. Wellington's secondary elevation reflects capital-area political or administrative friction. Auckland (13.5) maintains baseline urban risk. All other regions remain below 4.0, indicating that risk is geographically concentrated rather than diffuse; organizations with staff or assets in Canterbury or Wellington warrant heightened situational awareness and contingency review.
How GeoBit Would Assist
Intel Sweep and multi-source OSINT fusion would rapidly corroborate the 13 July public statements, Army movement, and government demands against news, social media, and official sources to establish incident scope and trajectory. AOI (Area-of-Interest) monitoring and early-warning alerting on Canterbury, Wellington, and Auckland would flag secondary incidents, protest activity, or enforcement action in real time, enabling proactive staff communication and route adjustment. Entity extraction and network analysis across government, Māori leadership, Electricity Authority, and industry actors would map the underlying dispute and identify likely friction points for the next 7–14 days.
7-Day Outlook
Policy or governance tension is likely to remain elevated through mid-week, with public statements and counter-statements continuing. Army occupation and government-vs-industry/settlement friction suggest resolution negotiations or standoff consolidation are underway; further escalation (road closures, utility disruption, or expanded occupation) is possible but not imminent. Organizations should maintain staff alertness, review travel restrictions to Canterbury and Wellington, and prepare for potential service delays in energy or transport sectors.
Highest-Risk Areas — Ranked
| # | State / Region | Risk |
|---|---|---|
| 1 | Canterbury | 31.5 |
| 2 | Wellington | 16.9 |
| 3 | Auckland | 13.5 |
| 4 | Northland | 3.2 |
| 5 | Bay of Plenty | 3.2 |
| 6 | West Coast | 3.2 |
| 7 | Otago | 3.2 |
| 8 | Tasman | 2.3 |
| 9 | Chatham Islands | 1.5 |
| 10 | Taranaki | 1.5 |
| 11 | Waikato | 1.5 |
| 12 | Manawatū-Whanganui | 1.5 |
Sources
Previous Daily Briefs
A new New Zealand brief is written every day — each with its own risk map and downloadable CSV. Here's the last week; use the calendar to go further back.
📅 Browse every day by calendar →
Highlighted days have a brief. Tap a day for that day's map & analysis, or “csv” for that day's dataset ($5).
Atlas — our AI intelligence desk — emails them this snapshot personally. Nothing else, no list.