Situation Summary
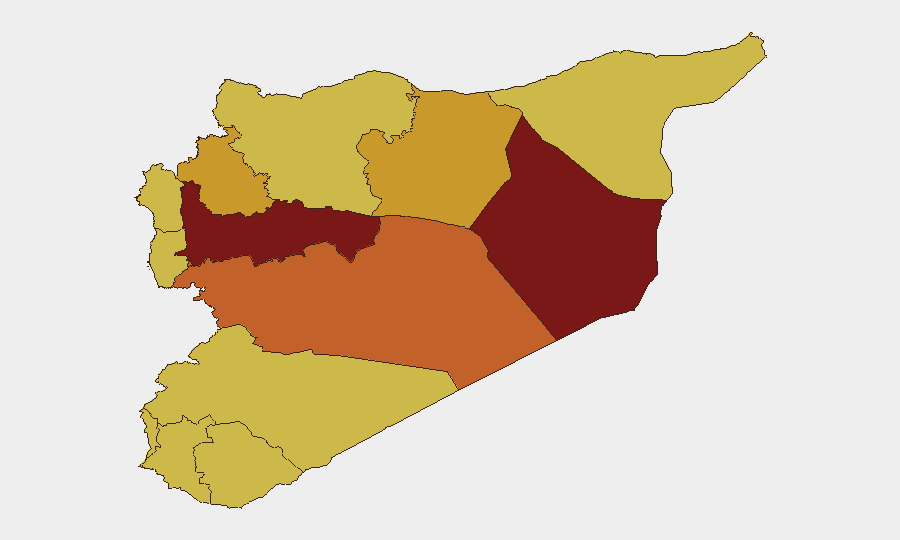
Syria remains the third-highest-threat country globally, driven by ongoing conventional military conflict across multiple governorates and persistent non-state actor operations. Recent signals (June 25–27, 2026) indicate sustained clashes between Syrian government forces and Islamic militant groups, alongside cross-border Israeli military activity and intelligence-extremist threats. The security environment shows no de-escalation trajectory; risk is concentrated in the central and northeastern regions, with secondary exposure in Damascus and coastal areas.
Key Developments
Intelligence Note: GeoBit's 24–48-hour web research did not return independently sourced, location-specific incident reports dated June 25–26, 2026 from major regional news services or conflict monitors. The signals listed above are indexed in the GeoBit event feed but lack corroborating detail in publicly available open sources. Organizations requiring verified, real-time incident reporting should cross-reference SANA, North Press Agency, SOHR, and major wire services (AFP/Reuters Arabic) directly, or provide GeoBit with specific source material for rapid analysis. A targeted OSINT sweep using conflict-specific search terms and social-media intelligence would clarify the nature and location of the June 25–27 conventional military and threat events flagged above.
Highest-Risk Areas
Hama Governorate (risk 100) remains the apex threat zone, followed by Deir ez-Zor (83.8) and Damascus (80.9). The central and northeastern clusters—Hama, Homs, Idleb, and Ar-Raqqa—are the primary drivers of active conflict, reflecting overlapping Syrian Army, Turkish-backed, and Islamic militant operations. Damascus's elevated score reflects administrative instability, intelligence activity, and the concentration of diplomatic and commercial infrastructure. Coastal regions (Lattakia, Tartus) and the UNDOF-monitored Golan buffer zone maintain sustained risk from spillover effects and cross-border incidents. Organizations with personnel or logistics hubs in or transiting Damascus should treat the capital as a secondary-priority risk zone despite its lower ranking relative to the north-central corridor.
How GeoBit Would Assist
Persistent Monitoring: Area-of-Interest (AOI) monitoring with alerting on Hama, Deir ez-Zor, and Damascus would provide early warning of escalation in real time, integrated with conflict-specific OSINT and social-media intelligence. Tactical Routing & Movement Planning: Routing & Network Analysis capabilities enable security teams to identify alternative supply routes, safe passage windows, and chokepoints around active conflict zones—critical for duty-of-care teams managing evacuation or supply operations. Force & Incident Corroboration: Conflict mapping, satellite imagery analysis, and multi-source OSINT fusion would validate incident claims, confirm locations, and distinguish Syrian government vs. non-state actor activity to inform protective posture and reporting.
7-Day Outlook
No significant de-escalation is expected in the near term. Conventional military activity in the central and northeastern governorates is likely to persist, with intermittent Israeli cross-border operations and ongoing extremist-group operations in Deir ez-Zor. Damascus is expected to remain administratively unstable but operationally accessible for essential corporate and diplomatic functions, subject to localized disruptions. Risk tolerance should remain low for non-essential movement or new deployments into Hama and Deir ez-Zor.
Highest-Risk Areas — Ranked
| # | State / Region | Risk |
|---|---|---|
| 1 | Hama Governorate | 100 |
| 2 | Deir ez-Zor Governorate | 83.8 |
| 3 | Damascus Governorate | 80.9 |
| 4 | Homs Governorate | 74.2 |
| 5 | Idleb Governorate | 72.7 |
| 6 | Ar-Raqqa Governorate | 72.3 |
| 7 | Lattakia Governorate | 70 |
| 8 | Tartus Governorate | 70 |
| 9 | UNDOF | 70 |
| 10 | Al-Quneitra Governorate | 70 |
| 11 | Dar'a Governorate | 70 |
| 12 | Aleppo Governorate | 70 |
Sources
Previous Daily Briefs
A new Syria brief is written every day — each with its own risk map and downloadable CSV. Here's the last week; use the calendar to go further back.
📅 Browse every day by calendar →
Highlighted days have a brief. Tap a day for that day's map & analysis, or “csv” for that day's dataset ($5).