Situation Summary
The United States faces a composite threat score of 100 globally, with 7,843 tracked events reflecting elevated institutional, civil, and investigative friction across multiple domains. Judicial, executive, legislative, and intelligence actors are generating disapproval and investigative signals at elevated frequency as of 1–3 July 2026. California and Texas dominate sub-national risk, driven by institutional discord, media oversight challenges, and regulatory investigations. The threat trajectory remains volatile without clear de-escalation signals.
Key Developments
- 2026-07-03 · Washington, D.C. – Public statement issued between Washington and Attorney office; nature and implications require corroboration.
- 2026-07-02 · National – Intelligence community issued disapproval signal toward Washington, indicating institutional disagreement on policy or operational direction.
- 2026-07-02 · National – Navy initiated investigation; scope and location not specified in available event data.
- 2026-07-02 · National – Google subject of investigation; jurisdiction and alleged conduct require confirmation.
- 2026-07-02 · California – Administrative sanctions issued against media entity by California authorities; regulatory or content-related enforcement implied.
- 2026-07-01 · California / San Francisco – Public statement issued between California authorities and San Francisco; localized policy or operational friction.
- 2026-07-01 · New York – Disapproval signal recorded; specific agency/issue not detailed in event summary.
- 2026-07-01 · Washington, D.C. – Rejection signal between Washington and President indicates executive-administrative conflict.
Note: Web research within the last 24–48 hours did not yield sufficient verified incident detail to provide location-specific crime, civil-unrest, or travel-risk advisories. CISA advisories on industrial-control systems were noted but lacked publication timestamps and affected-location specificity.
Highest-Risk Areas
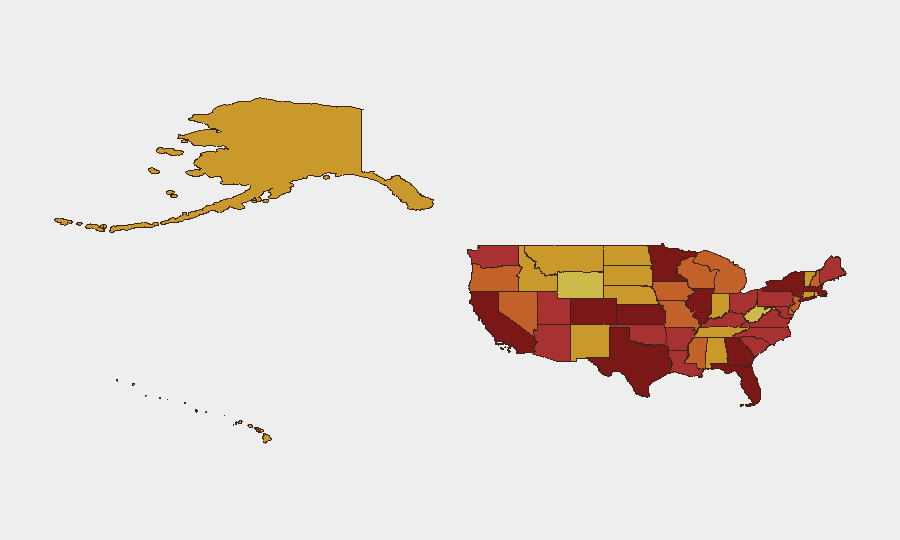
California (risk 100) and Texas (risk 99.6) anchor the threat landscape, with California's risk driven by jurisdictional friction between state and municipal authorities, media regulation actions, and ongoing investigations into technology platforms and criminal cases. Texas's near-parity risk score reflects similar institutional and investigative activity. The secondary tier—Kansas (95), New York (93.5), Florida (85.3), and Colorado (84.9)—shows persistent tension across legislative, judicial, and law-enforcement domains. Concentration of disapproval and investigation signals in coastal and technology-hub states suggests regulatory, cybersecurity, and institutional-integrity pressures dominate current threat vectors.
How GeoBit Would Assist
Security and risk teams should employ Intel Sweep and global event feeds to track ongoing institutional signals (judicial, executive, legislative) in real time, combined with X/Twitter and multi-language OSINT to detect emerging civil friction or threat escalation. Entity extraction and sentiment analysis would isolate which actors, policies, or investigations are driving individual state risk scores, enabling targeted duty-of-care responses. AOI Monitoring and Early Warning on California, Texas, New York, and Florida would provide persistent alerting for investigative, regulatory, or civil-unrest developments affecting asset and personnel safety.
7-Day Outlook
Institutional friction signals are likely to persist or deepen through early July as judicial and investigative processes continue. No indicators of rapid de-escalation are apparent; continued public statements and investigative actions should be anticipated. Risk teams should maintain elevated monitoring posture in top-five states and prepare contingency communications for affected personnel or assets.
Highest-Risk Areas — Ranked
| # | State / Region | Risk |
|---|---|---|
| 1 | California | 100 |
| 2 | Texas | 99.6 |
| 3 | Kansas | 95 |
| 4 | New York | 93.5 |
| 5 | Florida | 85.3 |
| 6 | Colorado | 84.9 |
| 7 | Massachusetts | 83.2 |
| 8 | Illinois | 83.1 |
| 9 | Georgia | 81.2 |
| 10 | Minnesota | 80.4 |
| 11 | Pennsylvania | 79.5 |
| 12 | North Carolina | 78.7 |
Sources
Previous Daily Briefs
A new United States brief is written every day — each with its own risk map and downloadable CSV. Here's the last week; use the calendar to go further back.
📅 Browse every day by calendar →
Highlighted days have a brief. Tap a day for that day's map & analysis, or “csv” for that day's dataset ($5).