Situation Summary
Cuba faces escalating civil unrest driven by cascading electrical grid failures and political repression. Since mid-July, the national power infrastructure has collapsed at least three times in over a week, triggering widespread cacerolazos (pot-and-pan protests) and state security crackdowns across multiple provinces. Political detention activity has intensified concurrent with the blackouts, creating a compounding stability risk with potential for broader civil friction.
Key Developments
- Guantánamo province (July 19–20) — Cubalex documented six arrests following anti-blackout protests in Loma del Chivo neighborhood; protesters used pots and banners; state security and uniformed police responded with detentions.
- Guanabacoa, Havana (July 17–18) — Residents of Loma de la Pela conducted cacerolazo over ongoing power outages; state security and local officials monitored the gathering, no arrests reported in initial accounts.
- Nationwide electrical grid (July 18–21) — Cuba's national grid experienced its third collapse in approximately 10 days; blackouts remain unresolved across multiple regions, with supply-demand and infrastructure stress cited as primary drivers.
- Political detention uptick (July 19–20) — Arrest/detention activity targeting political prisoners recorded in recent event signals; coincides with blackout-driven protest surge.
- International attention (July 19) — U.S. State Department issued appeal regarding Cuba; media outlets published critical statements on Cuban governance; international community disapproval signaled.
Highest-Risk Areas
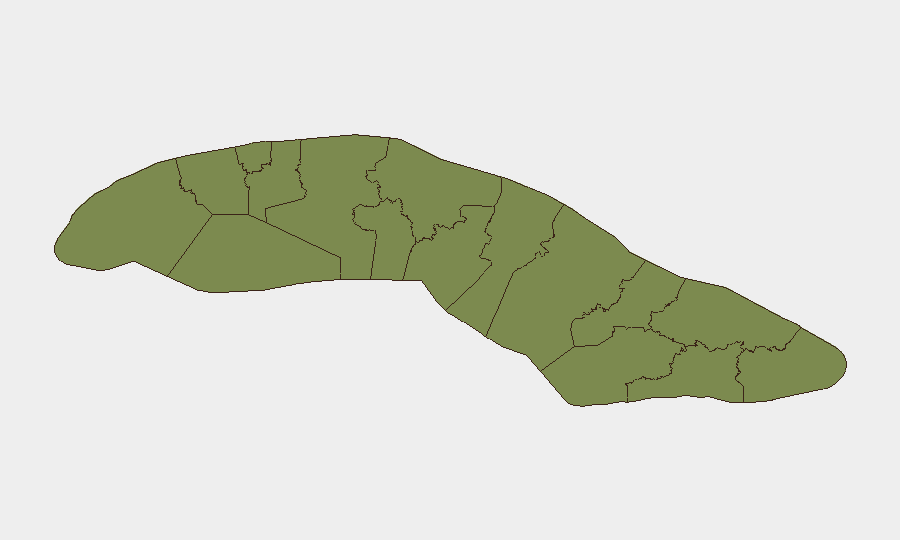
Sancti Spiritus (34.2) and Havana (33.7) dominate the risk landscape and together account for the majority of tracked security events. Havana's concentration reflects both population density and role as the political capital, where state security presence is highest and anti-government sentiment carries greatest symbolic weight. Sancti Spiritus's elevated score suggests acute localized instability—likely tied to blackout duration, economic hardship, or security force activity in that province. A secondary tier—Artemisa (9.9) and Matanzas (8.9)—shows material risk elevation; all remaining provinces score below 10, indicating risk is geographically concentrated rather than nationwide.
How GeoBit Would Assist
Corporate security teams should deploy Intel Sweep and multi-language event feeds to track arrest patterns, protest activity, and grid status updates in real time across provinces. AOI (Area-of-Interest) Monitoring & Early Warning on Havana, Sancti Spiritus, Artemisa, and Matanzas, coupled with sentiment & temporal analysis of social media (X/Twitter, Telegram, YouTube), will flag emerging flashpoints before incidents escalate. Regime-stability and political dissent search capabilities enable tracking of detention waves and activist networks, supporting duty-of-care assessments for personnel in high-risk zones. GIS-based spatial analysis can correlate blackout zones with protest locations and state security deployments to identify compound-risk corridors.
7-Day Outlook
Grid instability will likely persist; repair timelines remain unclear. Continued blackouts will sustain protest pressure and police responses, particularly in urban centers. Political detention activity may increase if demonstrations spread or if security forces perceive coordination. Risk of wider civil disorder remains moderate but elevated; economic hardship and infrastructure failure are potent grievance drivers in an already-constrained environment.
Highest-Risk Areas — Ranked
| # | State / Region | Risk |
|---|---|---|
| 1 | Sancti Spiritus | 34.2 |
| 2 | Havana | 33.7 |
| 3 | Artemisa | 9.9 |
| 4 | Matanzas | 8.9 |
| 5 | Santiago de Cuba | 7.7 |
| 6 | Camagüey | 5.7 |
| 7 | Pinar del Rio | 4.4 |
| 8 | Granma | 4.4 |
| 9 | Mayabeque | 4.2 |
| 10 | Cienfuegos | 4.2 |
| 11 | Villa Clara | 4.2 |
| 12 | Isle of Youth | 4.2 |
Sources
Previous Daily Briefs
A new Cuba brief is written every day — each with its own risk map and downloadable CSV. Here's the last week; use the calendar to go further back.
📅 Browse every day by calendar →
Highlighted days have a brief. Tap a day for that day's map & analysis, or “csv” for that day's dataset ($5).
Atlas — our AI intelligence desk — emails them this snapshot personally. Nothing else, no list.