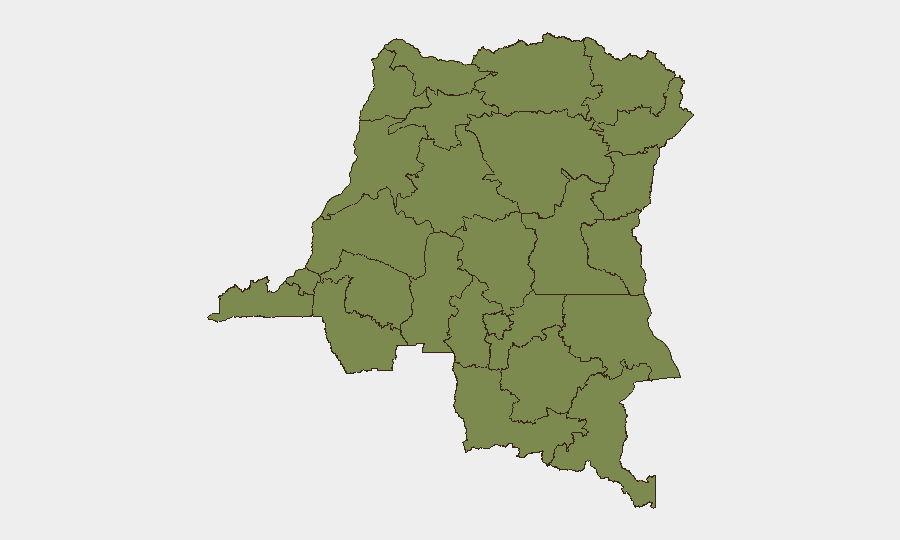
Situation Summary
DR Congo ranks #37 globally in composite threat exposure (score 55), reflecting persistent instability concentrated in eastern provinces rather than a nationwide crisis. South Kivu Province dominates the risk profile at 34.1—more than five times the risk of the capital—driven by ongoing armed-group activity, competition for mineral resources, and intercommunal tensions. The security environment remains volatile but regionally fragmented; western and central provinces show markedly lower threat density, though Kinshasa (rank 2) warrants continued monitoring due to political and urban crime dimensions.
Key Developments
- 2026-06-25 · South Kivu Province: Conventional military force incident involving DR Congo armed forces (FARDC) and a worker; specific location and casualties not yet detailed in available reporting. This represents the most recent tracked event and underscores ongoing FARDC operations or presence in the highest-risk zone.
- 2026-06-23 · National Level: Rejection of online content (Website); nature and actor unclear from signal alone, but consistent with ongoing information-control dynamics or removal of armed-group propaganda.
- 2026-06-23 · Kinshasa: Public statement attributed to "MEDINA" entity; context and implications require clarification on actor identity and message substance.
No additional incidents with confirmed dates in the past 24–48 hours have been reliably correlated to DR Congo-specific locations in the available signal set. Regional spillover (Chad–US diplomatic tensions, Israel-related statements) does not directly alter DR Congo's immediate operational threat profile.
Highest-Risk Areas
South Kivu's risk score of 34.1 towers above all other provinces, accounting for the majority of tracked events and reflecting M23 militia presence, FARDC counter-operations, and displacement of civilian populations. Secondary concern zones—Kinshasa (6.7), Tshopo (6.0), and Ituri (5.5)—indicate that eastern DRC broadly remains the pivot of instability, though Kinshasa's inclusion signals non-negligible political and criminal risk in the capital. Provinces in the northwest and central belt (Équateur, Mongala, Kasai regions) show baseline risk levels, suggesting they are lower-priority areas for personnel and asset protection planning unless operations are specifically rooted there.
How GeoBit Would Assist
Duty-of-care teams should deploy Area-of-Interest (AOI) Monitoring with alerting on South Kivu and Kinshasa to capture incident-level granularity in real time, paired with Network & Actor Analysis to map armed-group positions, FARDC deployments, and supply routes affecting safe passage. Battle mapping and force-structure tracking enable security officers to anticipate corridor accessibility and safe-haven timing. Routing & Network Analysis supports dynamic journey planning and alternative-route identification when South Kivu or road corridors are compromised. Conflict and OSINT intelligence sweeps (including Telegram, YouTube, and multi-language sources) provide early warning of escalation or humanitarian impacts that increase personnel risk.
7-Day Outlook
No imminent nationwide escalation is indicated; however, continued FARDC-M23 friction in South Kivu and ongoing urban crime in Kinshasa will sustain elevated local risk. Personnel and asset movements should remain contingent on real-time AOI intelligence rather than static risk assessments. A shift in diplomatic, cross-border, or resource-competition dynamics (particularly around Goma or mining zones) could rapidly elevate provincial threat levels; monitoring should remain continuous.
Highest-Risk Areas — Ranked
| # | State / Region | Risk |
|---|---|---|
| 1 | South Kivu | 34.1 |
| 2 | Kinshasa | 6.7 |
| 3 | Tshopo | 6 |
| 4 | Ituri | 5.5 |
| 5 | Maniema | 4.1 |
| 6 | Sud-Ubangi | 4.1 |
| 7 | Équateur | 4.1 |
| 8 | Nord-Ubangi | 4.1 |
| 9 | Mongala | 4.1 |
| 10 | Lower Uele | 4.1 |
| 11 | Tshuapa | 4.1 |
| 12 | Upper Uele | 4.1 |
Sources
Previous Daily Briefs
A new DR Congo brief is written every day — each with its own risk map and downloadable CSV. Here's the last week; use the calendar to go further back.
📅 Browse every day by calendar →
Highlighted days have a brief. Tap a day for that day's map & analysis, or “csv” for that day's dataset ($5).