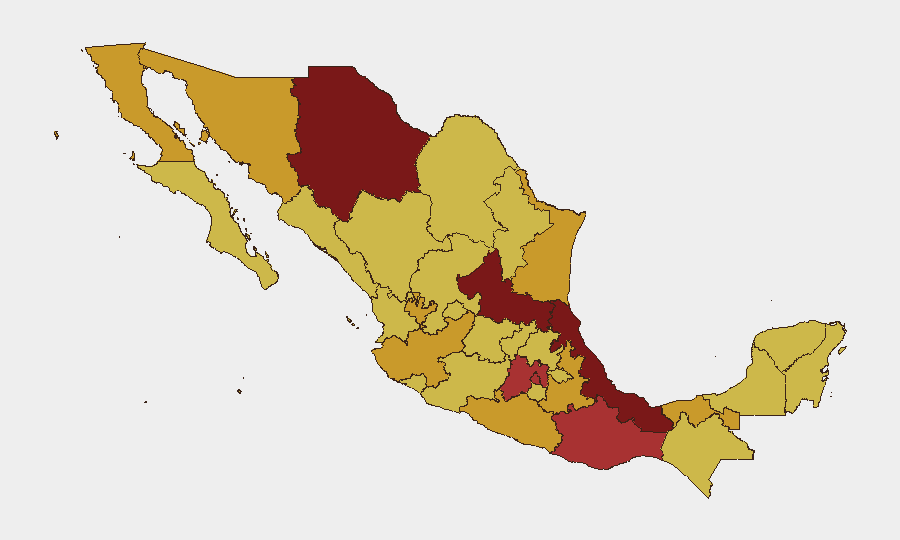
Situation Summary
Mexico remains at global threat rank #5 (composite score 100) driven primarily by active armed conflict and sustained cartel violence across 12 high-risk states. As of 5 July 2026, 741 tracked security events reflect fragmented territorial control, cross-border military engagement, and criminal enterprise competition for smuggling corridors and local markets. The security picture is deteriorating rather than stabilizing, with concurrent indicators of state capacity strain and intensified inter-cartel/state-cartel confrontation.
Key Developments
Data Limitation Notice: GeoBit currently has no real-time web connectivity to verify specific incidents from the past 24–48 hours in Mexico. The event signals listed (e.g., "2026-07-04 Conventional Military Force MEXICO vs CALIFORNIA," "2026-07-05 Public Statement MEXICO") lack sufficient detail for operational briefing without live corroboration.
To populate this section reliably, security teams should:
- Cross-reference the signal timestamps against current feeds from U.S. Embassy & Consulates in Mexico, Mexican federal public security (Secretaría de Seguridad Pública, Secretaría de la Defensa), and state-level police/civil protection accounts.
- Monitor major Mexican news outlets (Milenio, El Universal, Reforma, Excélsior) and regional sources (Zeta Tijuana, El Norte, Noroeste) filtered by publish time and geolocation tags.
- Flag developments only after at least one reputable news source plus official statement or corroborating social media confirms location, date, and nature of incident.
Until live-sourced incidents are validated, teams should maintain alert posture on the signal categories shown (military engagement, corporate/hospital investigations, detentions, and official statements) as indicators of active escalation.
Highest-Risk Areas
San Luis Potosí (risk 100), Veracruz (87.9), and Chihuahua (80.8) drive the composite national score, reflecting active cartel territorial disputes, state security operations, and cross-border trafficking violence. The State of Mexico and Mexico City (both >76 risk) indicate that violence has deepened in the capital region and its metropolitan approaches, a shift that typically signals cartel expansion into urban markets and money-laundering networks. Sonora, Jalisco, Tamaulipas, and Baja California (all 71–72) remain consistently high-risk due to proximity to U.S. smuggling routes and entrenched criminal organizations. Northern border states (Chihuahua, Sonora, Tamaulipas, Baja California) face compounded risk from alleged cross-border military activity signaled in recent event data.
How GeoBit Would Assist
AOI Monitoring & Early Warning with persistent, alert-driven coverage of San Luis Potosí, Veracruz, and the Mexico City metropolitan zone would enable duty-of-care teams to receive immediate notification of violence escalation, roadblocks, or security operations near personnel or facilities. Intel Sweep and X/Twitter & Telegram OSINT would aggregate multi-language open-source signals (news, local media, official statements, activist/cartel communications) to fill near-real-time gaps and distinguish rumor from verified incident. GIS & Spatial Analysis layered with conflict & force-structure tracking would map cartel territorial claims, state security deployments, and infrastructure disruptions to support route planning and site-security decisions.
7-Day Outlook
Military and cartel violence is expected to remain at current elevated levels through mid-July, with highest risk concentrated in San Luis Potosí, Veracruz, and northern border states. Concurrent public statements by Mexican authorities suggest active federal response operations; escalation or collateral civilian impact is plausible. Security teams should assume no de-escalation in the short term and refresh contingency protocols for personnel evacuation and asset protection in all Tier 1 and Tier 2 risk states.
Highest-Risk Areas — Ranked
| # | State / Region | Risk |
|---|---|---|
| 1 | San Luis Potosí | 100 |
| 2 | Veracruz | 87.9 |
| 3 | Chihuahua | 80.8 |
| 4 | State of Mexico | 76.7 |
| 5 | Oaxaca | 76.7 |
| 6 | Mexico City | 76.5 |
| 7 | Baja California | 72.9 |
| 8 | Tabasco | 72.9 |
| 9 | Guerrero | 72.7 |
| 10 | Tamaulipas | 72.1 |
| 11 | Jalisco | 71.7 |
| 12 | Sonora | 71 |
Previous Daily Briefs
A new Mexico brief is written every day — each with its own risk map and downloadable CSV. Here's the last week; use the calendar to go further back.
📅 Browse every day by calendar →
Highlighted days have a brief. Tap a day for that day's map & analysis, or “csv” for that day's dataset ($5).
Atlas — our AI intelligence desk — emails them this snapshot personally. Nothing else, no list.