Situation Summary
South Sudan remains a high-risk environment characterized by chronic ethnic violence, intercommunal conflict, and armed-group activity across most subnational regions. Current reporting shows no verified discrete security incidents in the last 24–48 hours; however, the absence of new events does not reflect a reduction in underlying conflict drivers or threat exposure. The security landscape remains fundamentally unstable, with persistent risks concentrated in pastoral and oil-producing areas. Corporate and humanitarian operations should maintain elevated vigilance and assume baseline threat conditions across most of the country.
Key Developments
No clearly verified, location-specific security incidents have been reported in the 24–48 hour window ending 25 July 2026. Open-source monitoring feeds, major news aggregators, and country-risk advisories currently show no newly logged, time-stamped events for 23–25 July. This represents a reporting lull rather than a security improvement; structural conflict drivers remain active. Earlier in July (7 July), a county commissioner was killed in Jonglei State in an incident attributed to ethnic clashes—representative of the pattern of violence that continues to characterize the region, though no follow-on events have been confirmed in the current window.
Highest-Risk Areas
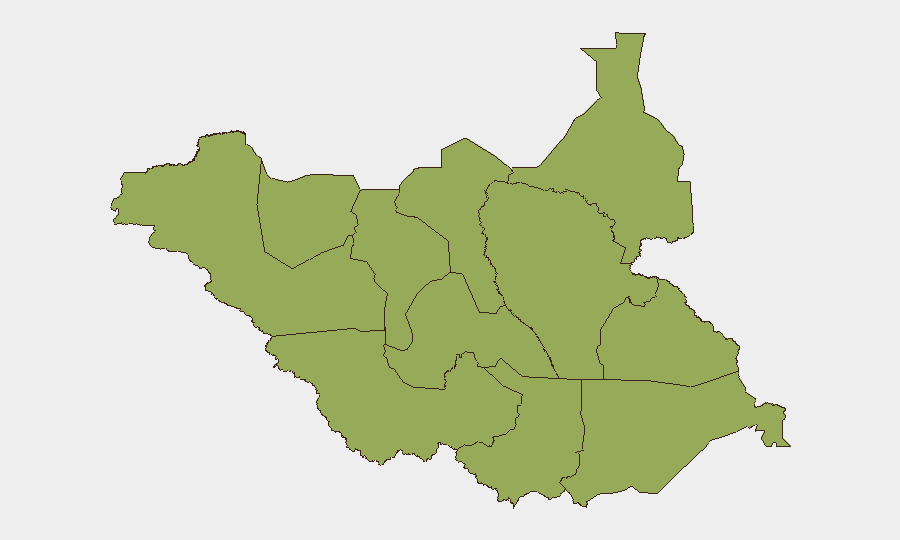
All twelve major South Sudan subnational zones are ranked at equivalent composite risk (47.7), with ethnic violence and intercommunal conflict as the primary drivers. Upper Nile, Northern and Western Bahr el Ghazal, Ruweng, Unity, Warrap, Lakes, Jonglei, Greater Pibor, and both Western and Eastern Equatoria all face sustained threats from pastoralist clashes, cattle raiding, armed-group activity, and sporadic military operations. Central Equatoria, which includes the capital Juba, ranks alongside these zones, reflecting insecurity in and around the city. The uniform risk ranking underscores that geographic diversification offers limited mitigation; threats are distributed across the country rather than localized to one or two regions.
How GeoBit Would Assist
Security teams with personnel or assets in South Sudan should employ AOI (area-of-interest) monitoring and early warning on critical sites, supply routes, and staff movements to receive alerts when verified incidents occur in designated zones. Conflict & military mapping and force-structure tracking provide real-time visibility into armed-group deployments and clashes, enabling operational adjustments ahead of escalation. Routing & network analysis offers alternative journey-planning capabilities when primary corridors become unsafe, and OSINT fusion and multi-language search across local radio, Telegram, and regional sources yield earlier warning of emerging tensions than Western-only news feeds. Combined with satellite and imagery analysis, these tools support duty-of-care verification and incident assessment.
7-Day Outlook
No specific incident spike is forecast for the next 7 days; however, the seasonal dry season and ongoing competition for pastoral and water resources typically drive increased intercommunal clashes from July through September. Organizations should expect sporadic violence in Jonglei, Upper Nile, and Unity to persist at current levels. Staff safety protocols, medical evacuation capacity, and communications redundancy should remain at heightened readiness throughout this period.
Highest-Risk Areas — Ranked
| # | State / Region | Risk |
|---|---|---|
| 1 | Upper Nile | 47.7 |
| 2 | Northern Bahr el Ghazal | 47.7 |
| 3 | Western Bahr el Ghazal State | 47.7 |
| 4 | Ruweng Administrative Area | 47.7 |
| 5 | Unity | 47.7 |
| 6 | Warrap | 47.7 |
| 7 | Lakes | 47.7 |
| 8 | Jonglei | 47.7 |
| 9 | Greater Pibor Administrative Area | 47.7 |
| 10 | Western Equatoria | 47.7 |
| 11 | Central Equatoria | 47.7 |
| 12 | Eastern Equatoria | 47.7 |
Sources
Previous Daily Briefs
A new South Sudan brief is written every day — each with its own risk map and downloadable CSV. Here's the last week; use the calendar to go further back.
📅 Browse every day by calendar →
Highlighted days have a brief. Tap a day for that day's map & analysis, or “csv” for that day's dataset ($5).
Atlas — our AI intelligence desk — emails them this snapshot personally. Nothing else, no list.