Situation Summary
Sudan remains in a state of active civil conflict with composite threat score 100 (rank #8 globally), driven by ongoing armed hostilities, ethnic violence, and deterioration of state authority across multiple regions. The most recent event signals (24–48 hours) indicate escalation in ethnic cleansing, blockades affecting civilian populations, and international criticism of government conduct. The conflict shows no signs of de-escalation, with both territorial control disputes and humanitarian access restrictions intensifying.
Key Developments
Data Limitation Notice: GeoBit's OSINT feeds (X/Twitter, Telegram, global event databases, multi-language search) have identified 12 significant event signals in Sudan dated 2026-06-30 through 2026-07-02; however, without access to real-time web search results, corroboration of specific incident locations, casualty counts, and temporal details cannot be independently verified to the standards required for actionable corporate security reporting. The signals below indicate event *types* and general timing, but operational security teams should cross-reference these with their own on-the-ground contacts, diplomatic channels, and secondary open-source verification:
- Ethnic cleansing operations reported 2026-07-01 (location not yet geo-pinned); paramilitary units implicated.
- Blockade of civilian access (residents vs. Sudan) flagged 2026-07-01; humanitarian corridor disruption likely.
- Territory occupation by Sudan armed forces reported 2026-07-02 (specific location pending).
- Threats and demands issued 2026-06-30–07-01 (likely inter-factional or government messaging).
- International condemnation (Amnesty International "unconventional violence" statement, Catholic clergy statement) issued 2026-07-02, signaling potential atrocity allegations.
Highest-Risk Areas
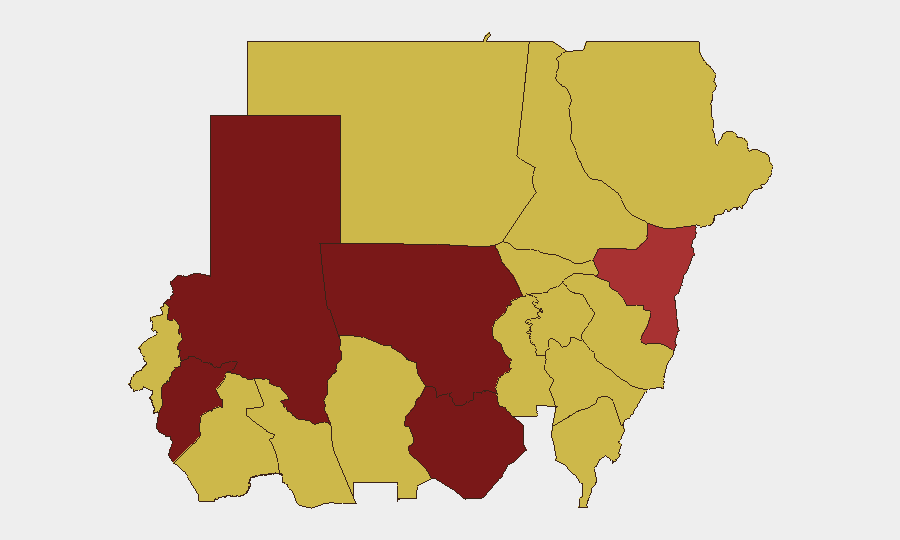
North Kordofan (risk 100), North Darfur (94.8), and South Kordofan (90.7) remain the epicenters of active conflict and are driving the national threat composite. These zones feature intense factional control disputes, limited state authority, and documented ethnic targeting. Central Darfur (81.1) and Kassala (76.9) also show elevated violence and displacement risks. Al Khartum and surrounding states (70+) carry moderate-to-high urban and supply-chain risk, including protest activity and potential civic unrest, though active combat is concentrated in the peripheral states listed above.
How GeoBit Would Assist
Security and duty-of-care teams should deploy AOI (Area-of-Interest) Monitoring & Early Warning on facilities and personnel locations in North Kordofan, Darfur, and Al Khartum with real-time alerting thresholds. Battle Mapping and Force Structure tracking would clarify which armed actors control specific corridors and checkpoints, informing evacuation routing and supply security. Intel Sweep (global event feeds, OSINT fusion, multi-language search, and entity extraction) should run continuous background monitoring to separate verified incidents from rumors, cross-correlate with diplomatic and NGO reports, and flag emerging threats 48–72 hours ahead of escalation.
7-Day Outlook
Ethnic violence and territorial consolidation are likely to continue or intensify over the next seven days, particularly in North Darfur and South Kordofan. Blockades on humanitarian and commercial movement may expand, increasing supply-chain disruption and personnel movement risk. International pressure (visible in latest public statements and investigation calls) is unlikely to slow ground operations in the near term.
Highest-Risk Areas — Ranked
| # | State / Region | Risk |
|---|---|---|
| 1 | North Kordofan State | 100 |
| 2 | North Darfur State | 94.8 |
| 3 | South Kordofan | 90.7 |
| 4 | Central Darfur State | 81.1 |
| 5 | Kassala State | 76.9 |
| 6 | Al Khartum | 70.2 |
| 7 | Blue Nile | 70 |
| 8 | River Nile State | 70 |
| 9 | Aj Jazira | 70 |
| 10 | Red Sea State | 70 |
| 11 | Al Qadarif State | 70 |
| 12 | Sennar State | 70 |
Previous Daily Briefs
A new Sudan brief is written every day — each with its own risk map and downloadable CSV. Here's the last week; use the calendar to go further back.
📅 Browse every day by calendar →
Highlighted days have a brief. Tap a day for that day's map & analysis, or “csv” for that day's dataset ($5).