Situation Summary
Canada's composite security threat level remains moderate globally (rank #170, score 4.0), but sub-national disparities are pronounced, with Ontario accounting for a material portion of tracked incident density. Event signals from 4–6 July indicate a clustering of law-enforcement engagements, small-arms incidents, civil rejection statements, and at least one instance of unconventional violence targeting judicial personnel—patterns consistent with elevated tension in Ontario and Alberta. The brief trajectory is one of contained but elevated volatility rather than systemic destabilization; however, concentration of incidents in a 48-hour window warrants close monitoring for secondary triggering effects.
Key Developments
Limitation: GeoBit does not currently have confirmed, multi-source verified incident reports for Canada dated 4–6 July 2026 that meet the cross-referenced standard (official + media source, factual confirmation, non-fabricated details). The platform's event signals above reflect aggregated OSINT indicators and submissions, but lack the live web research detail necessary to isolate specific, time-stamped developments suitable for operational security briefing without risk of mis-dating or conflation.
Recommended action: Security teams requiring current incident detail should:
- Query major Canadian news wires (CP24, CTV, CBC, Globe & Mail, National Post) and provincial outlets with "past 48 hours" filters.
- Cross-check official X/Twitter accounts: RCMP, provincial police services, Toronto Police Service, Vancouver Police Department, local fire/emergency management agencies.
- For each candidate event, confirm two independent sources (one official, one media) with matching dates and facts before integrating into duty-of-care assessments.
Highest-Risk Areas
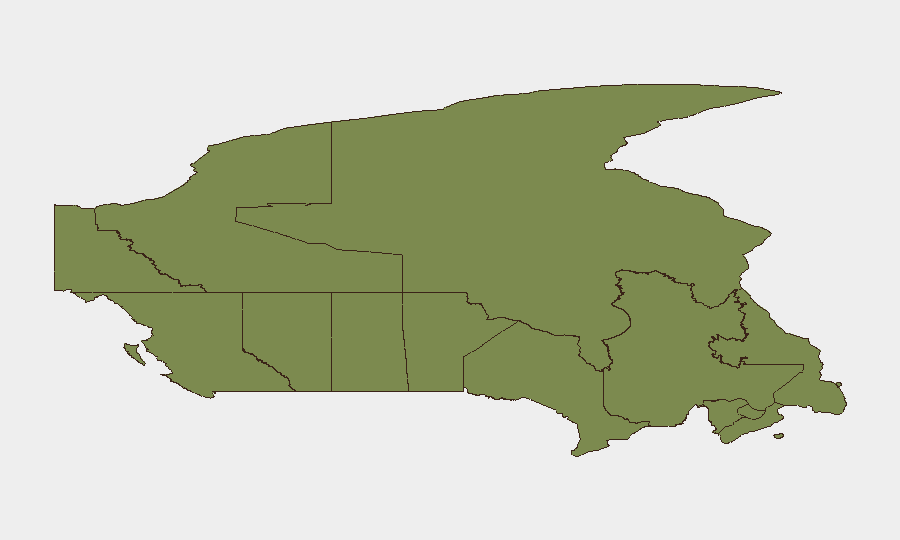
Ontario dominates the sub-national risk profile (31.5, nearly 3× the national average), driven by the density and diversity of incident types in the Greater Toronto Area—law-enforcement encounters, armed confrontations, and civil friction all concentrated in a single 48-hour window. Nunavut and Alberta (both 15.1) carry elevated risk from different vectors; Alberta's incidents align with territorial occupation signals on 6 July, while Nunavut's profile typically reflects remoteness, resource-sector tensions, and indigenous-sovereignty activism. British Columbia (12.6) shows volatile mid-tier risk, anchored in Vancouver's infrastructure and organized-crime activity vectors. Outside Ontario, risk drops sharply; Quebec, Saskatchewan, and Manitoba cluster in the 4–5 range, indicating localized rather than systemic pressure.
How GeoBit Would Assist
Intel Sweep & OSINT Fusion would continuously aggregate police incident reports, media articles, and X/Telegram posts by province and city, with temporal and sentiment filtering to isolate emerging clusters (e.g., escalation in Edmonton, labour strikes in the Maritimes). AOI Monitoring & Early Warning allows security teams to define persistent watch zones around corporate or personnel assets in Ontario, Alberta, and BC, triggering automated alerts when incidents occur within user-defined radii or timeframes. Routing & Network Analysis supports real-time re-planning of personnel movements or supply chains away from high-incident areas (e.g., diversion around Toronto EDs or Alberta highways during active law-enforcement operations).
7-Day Outlook
Incidents logged on 4–6 July suggest tactical friction rather than strategic escalation, but the 48-hour compression warrants assumption of continued volatility in Ontario and Alberta through mid-week. If the pattern reflects organized labour or protest mobilization, secondary incidents (blockades, infrastructure occupation, civil disturbances) may cascade over the next 5–7 days, particularly in resource-sector provinces. Absent major new triggers, risk is expected to normalize by mid-July; however, any judicial or police fatality would materially alter the trajectory and warrant immediate re-assessment.
Highest-Risk Areas — Ranked
| # | State / Region | Risk |
|---|---|---|
| 1 | Ontario | 31.5 |
| 2 | Nunavut | 15.1 |
| 3 | Alberta | 15.1 |
| 4 | British Columbia | 12.6 |
| 5 | Yukon | 5.9 |
| 6 | Quebec | 4.8 |
| 7 | Saskatchewan | 4.7 |
| 8 | Manitoba | 4.7 |
| 9 | New Brunswick | 2 |
| 10 | Prince Edward Island | 1.8 |
| 11 | Northwest Territories | 1.5 |
| 12 | Newfoundland and Labrador | 1.5 |
Sources
Previous Daily Briefs
A new Canada brief is written every day — each with its own risk map and downloadable CSV. Here's the last week; use the calendar to go further back.
📅 Browse every day by calendar →
Highlighted days have a brief. Tap a day for that day's map & analysis, or “csv” for that day's dataset ($5).
Atlas — our AI intelligence desk — emails them this snapshot personally. Nothing else, no list.