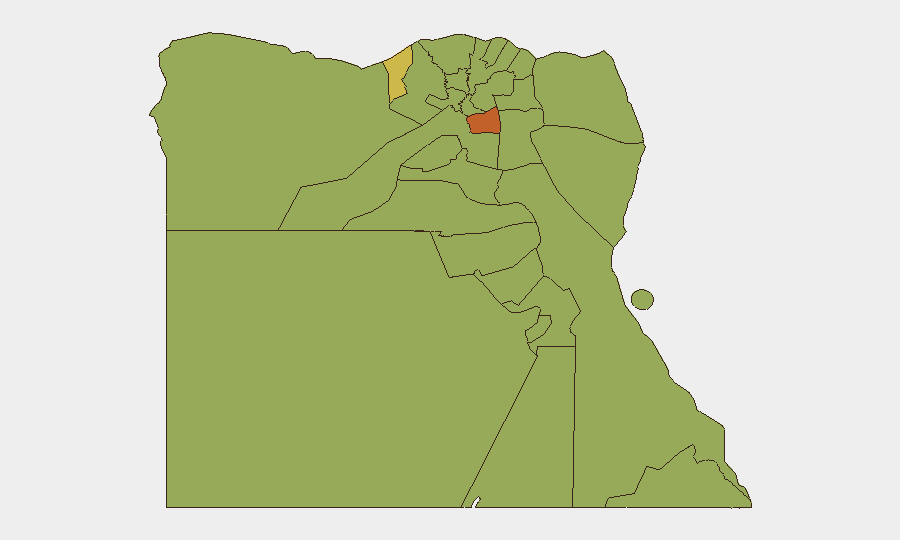
Situation Summary
Egypt's overall security posture remains ranked #26 globally (composite threat score 65) with 98 tracked events on record. The country exhibits a mosaic of localized risks: Cairo dominates the national threat profile with a risk score of 75.7, driven by political tension, civil unrest, and demonstration activity; peripheral regions including North Sinai, South Sinai, and Red Sea governorates face persistent terrorism risk and border instability. No major escalation or critical incident has been confirmed in the past 24–48 hours, but underlying political tensions and regional spillover dynamics warrant continuous monitoring.
Key Developments
Web research covering the last 24–48 hours has not surfaced any confirmed security incidents, attacks, arrests, or protests in Egypt with verifiable timestamps for 2026-07-28 or 2026-07-29. Recent official travel advisories (German Foreign Office, Australian Smartraveller) describe the internal political situation as "tense but stable," with standing warnings against demonstrations in Cairo and other major cities, but these reflect general risk posture rather than acute new events. The most recent event signals in the GeoBit platform include:
- 2026-07-28 · Reject (Cairo) — nature and context unclear from available data
- 2026-07-28 · Reject (Congress) — likely legislative action; details require deeper intelligence sweep
- 2026-07-27 · Disapprove (Lawyer) — civil society statement; lower immediate operational risk
- 2026-07-29 · Public Statement (Corporation) — corporate communication; context pending
Regional demand signals (2026-07-29) involving Egypt's neighbors (Syria, Lebanon, Iraq, Saudi Arabia, Yemen) suggest broader Levantine and Gulf tensions but do not currently indicate direct Egyptian exposure beyond diplomatic concern.
Note: GeoBit's event feed reflects signals of political friction, disapproval, and interstate demands, but does not yet surface specific kinetic incidents, mass-casualty events, or on-the-ground disruptions in the 24–48 hour window. Confirmation of underlying causes and operational impact requires targeted Intel Sweep and OSINT corroboration.
Highest-Risk Areas
Cairo (75.7) is the dominant risk driver, reflecting dense population, political volatility, and demonstrated vulnerability to civil unrest and protest activity. Alexandria (64.0) ranks second, combining tourism and port infrastructure with similar urban protest dynamics. North Sinai (46.6), South Sinai (45.7), and Red Sea (45.7) form a secondary risk tier shaped by active terrorism campaigns, ungoverned space, and border volatility with Israel and Sudan. The persistence of these regional scores indicates entrenched, not temporary, instability—primarily ISIS-affiliated cells in Sinai and recurring cross-border spillover from Israeli-Palestinian and Sudanese conflicts. Kafr El Sheikh (50.4) and Giza (47.6) suggest secondary concerns tied to population density and supply-chain exposure near Cairo.
How GeoBit Would Assist
Corporate security teams in Egypt should employ persistent AOI Monitoring & Early Warning on Cairo, Alexandria, and North Sinai to detect emerging protest activity, security force deployments, or terrorist operations before operational disruption. Multi-language OSINT fusion—combining X/Twitter, Telegram, local news, and official statements—provides real-time sentiment and actor network analysis to anticipate civil unrest. Routing & Network Analysis supports duty-of-care teams in dynamic journey planning around flash protests or checkpoints, while conflict and terrorism search maintains updated threat libraries on Sinai-based groups and border incidents.
7-Day Outlook
No near-term trigger for major escalation is visible, but political friction signals and regional demand activity suggest monitoring intensity should remain elevated. Demonstration risk in Cairo remains standing; continued Sinai counter-terror operations are expected. Recommendation: maintain daily brief cadence and activate deeper Intel Sweep if event signal frequency or severity increases.
Highest-Risk Areas — Ranked
| # | State / Region | Risk |
|---|---|---|
| 1 | Cairo | 75.7 |
| 2 | Alexandria | 64 |
| 3 | Kafr El Sheikh | 50.4 |
| 4 | Giza | 47.6 |
| 5 | North Sinai | 46.6 |
| 6 | Qena | 45.7 |
| 7 | South Sinai | 45.7 |
| 8 | Red Sea | 45.7 |
| 9 | Halaib Triangle | 45.7 |
| 10 | Matruh | 45.7 |
| 11 | The Lake | 45.7 |
| 12 | Al Minufiya | 45.7 |
Sources
Previous Daily Briefs
A new Egypt brief is written every day — each with its own risk map and downloadable CSV. Here's the last week; use the calendar to go further back.
📅 Browse every day by calendar →
Highlighted days have a brief. Tap a day for that day's map & analysis, or “csv” for that day's dataset ($5).
Atlas — our AI intelligence desk — emails them this snapshot personally. Nothing else, no list.